kinetix360

BB - MFI/RSI [Modified from LazyBear]

2044
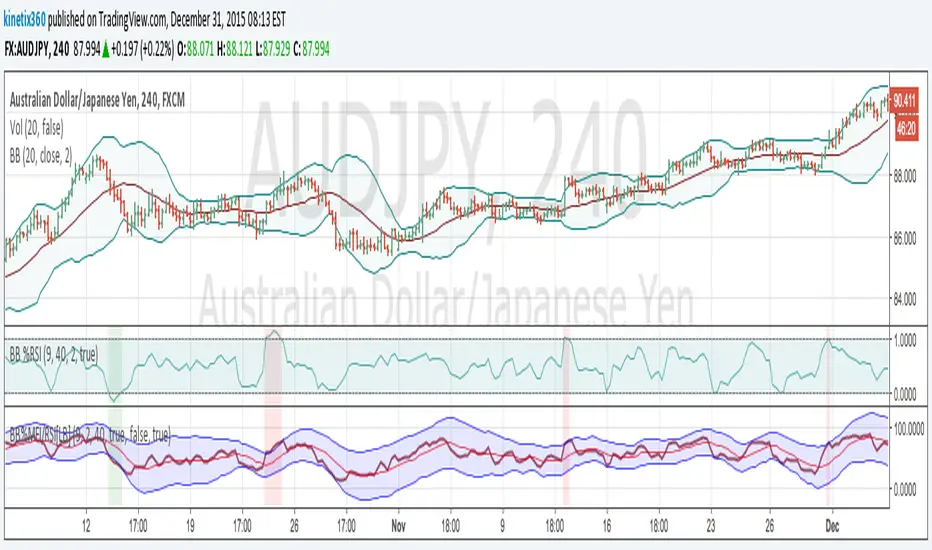
Here is the modification from BB-MFI/RSI from LazyBear. I add the period for the BB as told by John Bollinger in his book.

Base on his book, he suggest to try :

9p RSI with 40p BB and Stdv 2.0
14p RSI with 50p BB and Stdv 2.1
10p MFI with 40p BB and Stdv 2.0

The idea is to compare the short period in indicator with Long period of BB.

開源腳本

本著真正的TradingView精神,該腳本的作者將其開源發布,以便交易者可以理解和驗證它。為作者喝彩吧!您可以免費使用它,但在出版物中重複使用此代碼受網站規則的約束。 您可以收藏它以在圖表上使用。

免責聲明

這些資訊和出版物並不意味著也不構成TradingView提供或認可的金融、投資、交易或其他類型的意見或建議。請在使用條款閱讀更多資訊。

想在圖表上使用此腳本?
//
// @author LazyBear
// RSI/MFI with Bollinger Bands. Dynamic Oversold/Overbought levels, yayy!
// I add the BB period setting as told by John Bollinger's Book. 
study(title = "BB% of MFI/RSI [Modified from LazyBear]", shorttitle="BB%MFI/RSI[LB]")
source = hlc3
length = input(14, minval=1), mult = input(2.0, minval=0.001, maxval=50), bblength = input(50, minval=1, title="BB Period")
DrawRSI_f=input(true, title="Draw RSI?", type=bool)
DrawMFI_f=input(false, title="Draw MFI?", type=bool)
HighlightBreaches=input(true, title="Highlight Oversold/Overbought?", type=bool)

DrawMFI = (not DrawMFI_f) and (not DrawRSI_f) ? true : DrawMFI_f
DrawRSI = (DrawMFI_f and DrawRSI_f) ? false : DrawRSI_f
// RSI
rsi_s = DrawRSI ? rsi(source, length) : na
plot(DrawRSI ? rsi_s : na, color=maroon, linewidth=2)

// MFI
upper_s = DrawMFI ? sum(volume * (change(source) <= 0 ? 0 : source), length) : na
lower_s = DrawMFI ? sum(volume * (change(source) >= 0 ? 0 : source), length) : na
mf = DrawMFI ? rsi(upper_s, lower_s) : na
plot(DrawMFI ? mf : na, color=green, linewidth=2)


// Draw BB on indices
bb_s = DrawRSI ? rsi_s : DrawMFI ? mf : na
basis = sma(bb_s, length)
dev = mult * stdev(bb_s, bblength)
upper = basis + dev
lower = basis - dev
plot(basis, color=red)
p1 = plot(upper, color=blue)
p2 = plot(lower, color=blue)
fill(p1,p2, blue)

b_color = (bb_s > upper) ? red : (bb_s < lower) ? green : na
bgcolor(HighlightBreaches ? b_color : na)