INVITE-ONLY SCRIPT
RSI with OB and OS zones
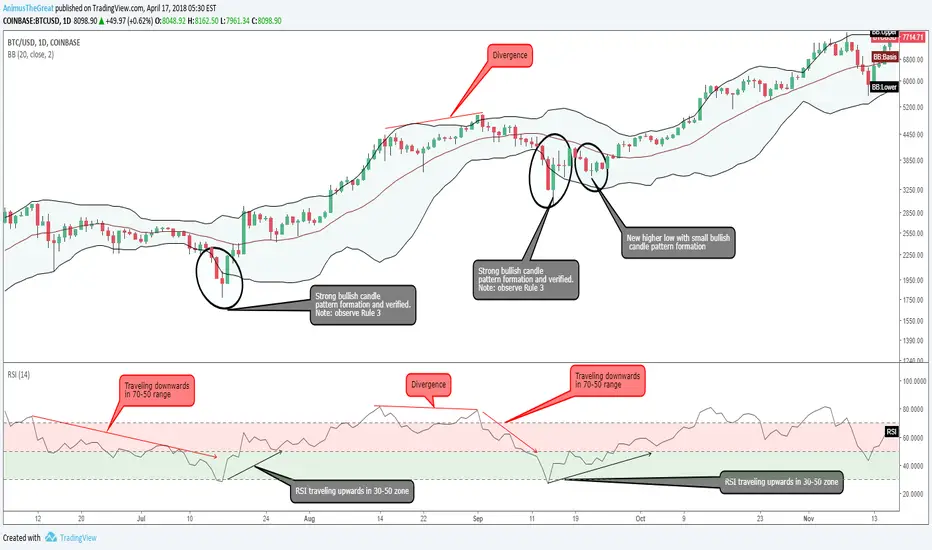
This indicator was created in order to provide better visualization of the Overbought and Oversold areas and to use those area for the principles of trading with Bollinger bands.
Basic rules for trading with BB and RSI:
- When a new high/low price trades outside a band and subsequent highs/lows are falling inside the band...signal for possible price/trend reversal.
- Compare the Bollinger bandwidth at key price levels. The bands constrict and provide an early warning signal before a big price change
Connected with RSI:
Rule #1
Once the price hits the bottom of the band, RSI needs to be in between 50 and 30. If it is for example at the 75 mark, than this might not be something you would be interested in. At the same time you need to see also RSI go up, in this case, in direction of the trade. If you are planning to short the trade, RSI needs to be in between 50-70 mark and going downward.
Rule #2- Find a cryptocurrency that is in uptrend if you are planning to go long, or downtrend if you are planning to short the trade. Skip sideways trending currencies.
Rule #3 - The currency must fall back (from the uptrend) and drops out, touches, or almost touches the bottom band. Once the price touches the bottom of the band, look a the RSI indicator for confirmation (needs to be in 30-50 range moving upwards). At the same time you need to see also RSI go up, in this case, in direction of the trade. If you are planning to short the trade, RSI needs to be in between 50-70 mark and going downward.
Rule #4: After price hits lower Bollinger band, and RSI is going upwards, make entry when…
…when you see STRONG BULLISH candle to the upside, you see consecutive reversal candles to the upside, or you find a bullish pattern forming. You need to see that the trend is moving upwards, in this case, before you enter a trade.
If the candlesticks are moving to a point where it is making a new low, this would not be a good time to enter a trade. However, once the candles fail to make a new low watch to see if it forms a bullish formation. Something else you can consider is when the price touches the middle band you can make a second entry to press your winners.
僅限邀請腳本
僅作者批准的使用者才能訪問此腳本。您需要申請並獲得使用許可,通常需在付款後才能取得。更多詳情,請依照作者以下的指示操作,或直接聯絡AnimusTheGreat。
TradingView不建議在未完全信任作者並了解其運作方式的情況下購買或使用腳本。您也可以在我們的社群腳本中找到免費的開源替代方案。
作者的說明
免責聲明
這些資訊和出版物並非旨在提供,也不構成TradingView提供或認可的任何形式的財務、投資、交易或其他類型的建議或推薦。請閱讀使用條款以了解更多資訊。
僅限邀請腳本
僅作者批准的使用者才能訪問此腳本。您需要申請並獲得使用許可,通常需在付款後才能取得。更多詳情,請依照作者以下的指示操作,或直接聯絡AnimusTheGreat。
TradingView不建議在未完全信任作者並了解其運作方式的情況下購買或使用腳本。您也可以在我們的社群腳本中找到免費的開源替代方案。
作者的說明
免責聲明
這些資訊和出版物並非旨在提供,也不構成TradingView提供或認可的任何形式的財務、投資、交易或其他類型的建議或推薦。請閱讀使用條款以了解更多資訊。