OPEN-SOURCE SCRIPT
DecisionPoint Breadth Swenlin Trading Oscillator [LazyBear]
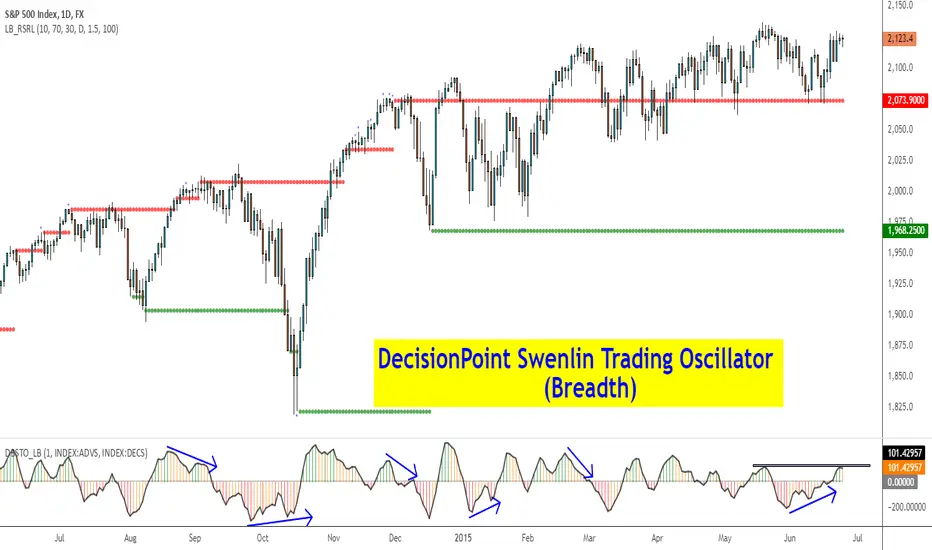
DecisionPoint Swenlin Trading Oscillator can be used to identify short-term tops and bottoms. This is a breadth indicator. STO is designed to be calculated using either issues or volume, I will post a follow up indicator that makes use of volume.
You can read about the interpretation of the signals (& gotchas) in the link below.
I have added support for NYSE / NASD / AMEX and also a combined mode. You can specify custom advancing/declining mkt symbols too.
More Info:
stockcharts.com/school/doku.php?id=chart_school:technical_indicators:dpstov
List of my public indicators: bit.ly/1LQaPK8
List of my app-store indicators: blog.tradingview.com/?p=970
開源腳本
本著TradingView的真正精神,此腳本的創建者將其開源,以便交易者可以查看和驗證其功能。向作者致敬!雖然您可以免費使用它,但請記住,重新發佈程式碼必須遵守我們的網站規則。
List of my free indicators: bit.ly/1LQaPK8
List of my indicators at Appstore: blog.tradingview.com/?p=970
List of my indicators at Appstore: blog.tradingview.com/?p=970
免責聲明
這些資訊和出版物並不意味著也不構成TradingView提供或認可的金融、投資、交易或其他類型的意見或建議。請在使用條款閱讀更多資訊。