INVITE-ONLY SCRIPT
已更新 The Multi Touch Confluence Indicator Subplot
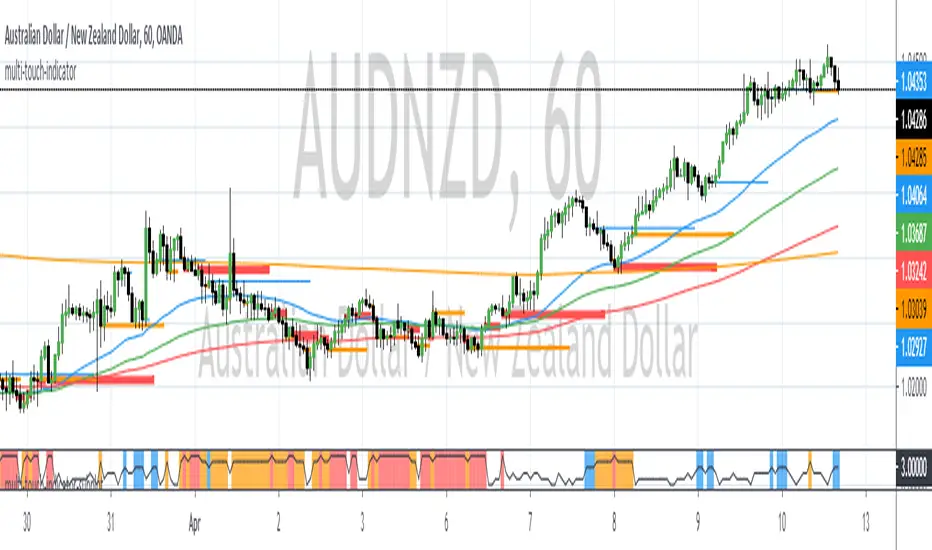
The Multi Touch EMA Confluence Indicator Subplot identifies zones where EMAs across 6 different time frames are within a specified range in proximity of the close value. These zones indicate confluence of EMAs.
The confluence zone is specified as a point difference.
When confluence is found, the indicator will paint vertical lines of different color and width.
The maximum number of time frames being used is 6.
The maximum number of EMAs per time frame is 4.
When confluence occurs it usually indicates a precursor of price expansion. This indicator can be used to determine when momentum is about to come back into the market.
The confluence zone is specified as a point difference.
When confluence is found, the indicator will paint vertical lines of different color and width.
- Blue Zones indicate a confluence of 3 EMAs across all time frames
- Orange Zones indicate a confluence of 4 EMAs across all time frames
- Red Zones indicate a confluence of 5 or more EMAs across all time frames.
The maximum number of time frames being used is 6.
The maximum number of EMAs per time frame is 4.
When confluence occurs it usually indicates a precursor of price expansion. This indicator can be used to determine when momentum is about to come back into the market.
發行說明
fix: Refined confluence algorithm thresholds. 僅限邀請腳本
僅作者批准的使用者才能訪問此腳本。您需要申請並獲得使用許可,通常需在付款後才能取得。更多詳情,請依照作者以下的指示操作,或直接聯絡LiquidityTracker。
TradingView不建議在未完全信任作者並了解其運作方式的情況下購買或使用腳本。您也可以在我們的社群腳本中找到免費的開源替代方案。
作者的說明
免責聲明
這些資訊和出版物並非旨在提供,也不構成TradingView提供或認可的任何形式的財務、投資、交易或其他類型的建議或推薦。請閱讀使用條款以了解更多資訊。
僅限邀請腳本
僅作者批准的使用者才能訪問此腳本。您需要申請並獲得使用許可,通常需在付款後才能取得。更多詳情,請依照作者以下的指示操作,或直接聯絡LiquidityTracker。
TradingView不建議在未完全信任作者並了解其運作方式的情況下購買或使用腳本。您也可以在我們的社群腳本中找到免費的開源替代方案。
作者的說明
免責聲明
這些資訊和出版物並非旨在提供,也不構成TradingView提供或認可的任何形式的財務、投資、交易或其他類型的建議或推薦。請閱讀使用條款以了解更多資訊。