INVITE-ONLY SCRIPT
Indicator Guru Oscillator
Indicator Guru Oscillator
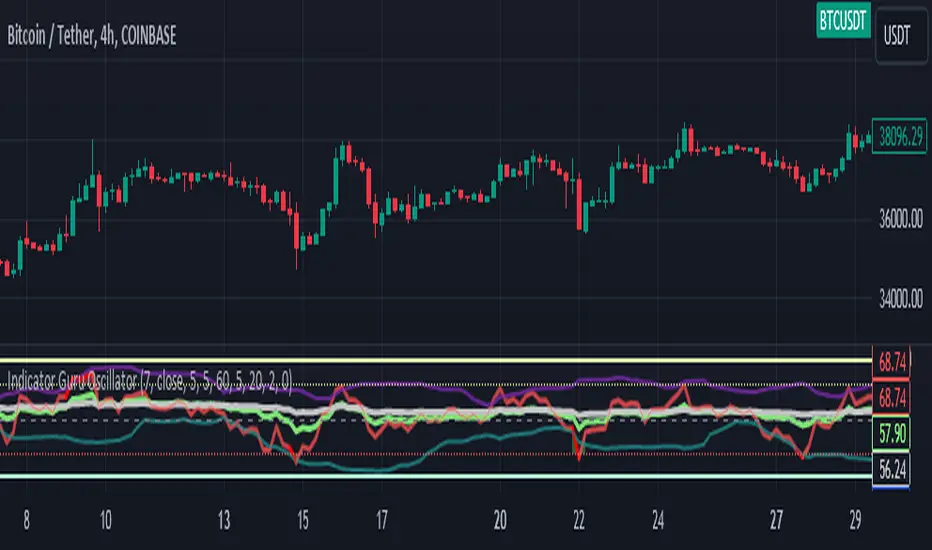
The "Indicator Guru Oscillator" is a custom trading indicator designed for technical analysis on financial charts. It combines elements of the Relative Strength Index with additional features to provide insights into potential overbought and oversold conditions.
1. ING FAST: This component calculates the Relative Strength Index based on a ING FAST-period lookback period (len) using a specified source (src), which is set to the closing price by default. The result is color-coded for better visualization:
A. Red when ING FAST is greater than or equal to 80 (indicating potential overbought conditions).
B. Dark red when ING FAST is less than or equal to 20 (indicating potential oversold conditions).
C. Light red for values in between.
2. ING MID: This component calculates the longer ING MID-period lookback, providing a medium-term perspective. Similar color-coding is applied based on overbought and oversold conditions.
3. ING SLOW: This component calculates the with an even longer ING SLOW-period lookback, offering a more extended-term view. Users have the flexibility to customize the color for this component.
4. Modified Plots
The plots for each RSI component are displayed with sparkline-style lines, making it easier to visualize the oscillator's movement. The color-coding helps traders quickly identify potential trading signals.
The "ING FAST" plot is color-coded based on overbought and oversold conditions.
The "ING MID" plot follows a similar color-coding scheme with different colors.
The "ING SLOW" plot allows users to choose a custom color.
5. Overbought and Oversold Levels
Horizontal lines are drawn at 50 (the mid line), 80 (overbought level), and 20 (oversold level) to provide reference points for traders.
6. Usage
This script can be used for identifying potential trend reversals, overbought, and oversold conditions in the market. Traders can customize the input parameters, such as lookback periods and color preferences, to align the indicator with their trading strategies.
Long And Short Zone
1. When the line closes above the ING Fast 80 (overbought level) zone and changes from light red color to dark red color, then there is a strong bullish zone.

2. Whenever ING Fast and ING Mid simultaneously cross above ING Slow and closing is above ING Slow then a big move occurs.

A. We can also see how having all three together resulted in a better move.

3. There is a Long zone when ING Fast reaches the 20 (oversold level) zone and the light red color changes to green with a darker red color. The last bearish and profit book signal comes when ING FAST is 80 (overbought level) and goes from light red to dark red and then when ING FAST comes to light red there is an area for bearish and profit booking Is.

A. Let's look at another example: As soon as ING Fast reaches the 20 (oversold levels) are the light red color changes to green with a darker red color. from bullish zone

B. Similarly whenever ING FAST is 80 (overbought level) and goes from light red to dark red and then when ING FAST comes to light red there is an area for bearish.

4. When the BB is squeezed and ING Fast, ING Mid, ING Slow are inside it, then a range bond market exists. Then there is No market movement

A. One More Ex.

The "Indicator Guru Oscillator" is a custom trading indicator designed for technical analysis on financial charts. It combines elements of the Relative Strength Index with additional features to provide insights into potential overbought and oversold conditions.
1. ING FAST: This component calculates the Relative Strength Index based on a ING FAST-period lookback period (len) using a specified source (src), which is set to the closing price by default. The result is color-coded for better visualization:
A. Red when ING FAST is greater than or equal to 80 (indicating potential overbought conditions).
B. Dark red when ING FAST is less than or equal to 20 (indicating potential oversold conditions).
C. Light red for values in between.
2. ING MID: This component calculates the longer ING MID-period lookback, providing a medium-term perspective. Similar color-coding is applied based on overbought and oversold conditions.
3. ING SLOW: This component calculates the with an even longer ING SLOW-period lookback, offering a more extended-term view. Users have the flexibility to customize the color for this component.
4. Modified Plots
The plots for each RSI component are displayed with sparkline-style lines, making it easier to visualize the oscillator's movement. The color-coding helps traders quickly identify potential trading signals.
The "ING FAST" plot is color-coded based on overbought and oversold conditions.
The "ING MID" plot follows a similar color-coding scheme with different colors.
The "ING SLOW" plot allows users to choose a custom color.
5. Overbought and Oversold Levels
Horizontal lines are drawn at 50 (the mid line), 80 (overbought level), and 20 (oversold level) to provide reference points for traders.
6. Usage
This script can be used for identifying potential trend reversals, overbought, and oversold conditions in the market. Traders can customize the input parameters, such as lookback periods and color preferences, to align the indicator with their trading strategies.
Long And Short Zone
1. When the line closes above the ING Fast 80 (overbought level) zone and changes from light red color to dark red color, then there is a strong bullish zone.
2. Whenever ING Fast and ING Mid simultaneously cross above ING Slow and closing is above ING Slow then a big move occurs.
A. We can also see how having all three together resulted in a better move.
3. There is a Long zone when ING Fast reaches the 20 (oversold level) zone and the light red color changes to green with a darker red color. The last bearish and profit book signal comes when ING FAST is 80 (overbought level) and goes from light red to dark red and then when ING FAST comes to light red there is an area for bearish and profit booking Is.
A. Let's look at another example: As soon as ING Fast reaches the 20 (oversold levels) are the light red color changes to green with a darker red color. from bullish zone
B. Similarly whenever ING FAST is 80 (overbought level) and goes from light red to dark red and then when ING FAST comes to light red there is an area for bearish.
4. When the BB is squeezed and ING Fast, ING Mid, ING Slow are inside it, then a range bond market exists. Then there is No market movement
A. One More Ex.
僅限邀請腳本
僅作者批准的使用者才能訪問此腳本。您需要申請並獲得使用許可,通常需在付款後才能取得。更多詳情,請依照作者以下的指示操作,或直接聯絡Indicator_guru。
TradingView不建議在未完全信任作者並了解其運作方式的情況下購買或使用腳本。您也可以在我們的社群腳本中找到免費的開源替代方案。
作者的說明
Access at https://www.indicatorguru.com
免責聲明
這些資訊和出版物並非旨在提供,也不構成TradingView提供或認可的任何形式的財務、投資、交易或其他類型的建議或推薦。請閱讀使用條款以了解更多資訊。
僅限邀請腳本
僅作者批准的使用者才能訪問此腳本。您需要申請並獲得使用許可,通常需在付款後才能取得。更多詳情,請依照作者以下的指示操作,或直接聯絡Indicator_guru。
TradingView不建議在未完全信任作者並了解其運作方式的情況下購買或使用腳本。您也可以在我們的社群腳本中找到免費的開源替代方案。
作者的說明
Access at https://www.indicatorguru.com
免責聲明
這些資訊和出版物並非旨在提供,也不構成TradingView提供或認可的任何形式的財務、投資、交易或其他類型的建議或推薦。請閱讀使用條款以了解更多資訊。