OPEN-SOURCE SCRIPT
已更新 Better Divergence On Any Indicator [DoctaBot]
This is an expansion of the Tradingview built in Divergences indicator (bottom) with 2 MAJOR differences.
First, and most importantly, the built in indicator identifies pivots in your chosen oscillator, but then utilizes the corresponding candle's HIGH or LOW to identify potential divergences. I'm not a fan of this method because oscillator values are typically calculated using the candle CLOSE values, so, in my opinion, divergences should be identified using the candle CLOSE value as well, as they are in this script.
Second, the built in divergence indicator only looks back one oscillator pivot for potential divergences. I coded this to look back one additional pivot as well to identify more valid potential divergences. The script will only identify these types of "multiple pivot divergences" if the oscillator pivot in between the two diverging pivots DOES NOT intersect the line being drawn them.
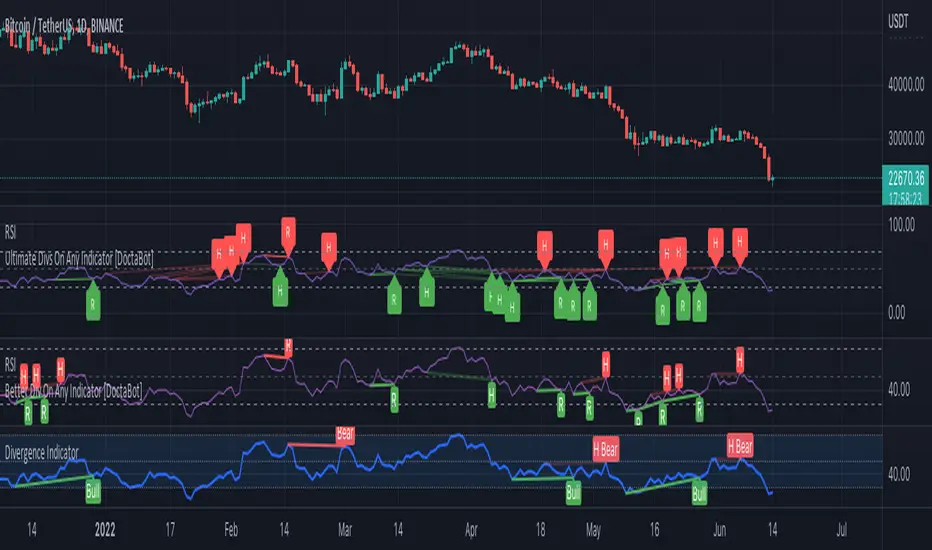
Notes for chart:
#1: This built in Divergence indicator misses this hidden bearish divergence because of the pivot in between (marked with red vertical line). No divergence exists between the most recent pivots, but it does if we compare it to the next one back.
#2: The RSI14 is making a lower high here, the first criteria for a bearish divergence. The built in Divergence indicator then references the candles' HIGHS. Because the most recent HIGH exceeds the previous one, it is considered a higher high and incorrectly identified as a bearish divergence. If we use the candle CLOSE price to identify divergences, this does not qualify.
#3: Here, we see both of the updates in action. Neither of these bearish divergences are identified with the built in Divergence Indicator. The first divergence s missed due to the use of candle HIGHS rather than closes; the original HIGH is greater than the next HIGH, however, comparison of closes shows that it is, in fact, a higher CLOSE. The second divergence is missed because original indicator can only look back one pivot and, consequently, misses the divergence between the next one back.
Please note, you may notice while using this script that some of the older divergences do not show any lines between the oscillator pivots. THIS IS NOT A BUG! In order to draw divergence lines properly for multiple pivots back, I had to use the line.new functions rather than plot functions. These line functions will delete old lines when a certain number have been drawn on the chart so these old ones are automatically erased as time passes.
First, and most importantly, the built in indicator identifies pivots in your chosen oscillator, but then utilizes the corresponding candle's HIGH or LOW to identify potential divergences. I'm not a fan of this method because oscillator values are typically calculated using the candle CLOSE values, so, in my opinion, divergences should be identified using the candle CLOSE value as well, as they are in this script.
Second, the built in divergence indicator only looks back one oscillator pivot for potential divergences. I coded this to look back one additional pivot as well to identify more valid potential divergences. The script will only identify these types of "multiple pivot divergences" if the oscillator pivot in between the two diverging pivots DOES NOT intersect the line being drawn them.
Notes for chart:
#1: This built in Divergence indicator misses this hidden bearish divergence because of the pivot in between (marked with red vertical line). No divergence exists between the most recent pivots, but it does if we compare it to the next one back.
#2: The RSI14 is making a lower high here, the first criteria for a bearish divergence. The built in Divergence indicator then references the candles' HIGHS. Because the most recent HIGH exceeds the previous one, it is considered a higher high and incorrectly identified as a bearish divergence. If we use the candle CLOSE price to identify divergences, this does not qualify.
#3: Here, we see both of the updates in action. Neither of these bearish divergences are identified with the built in Divergence Indicator. The first divergence s missed due to the use of candle HIGHS rather than closes; the original HIGH is greater than the next HIGH, however, comparison of closes shows that it is, in fact, a higher CLOSE. The second divergence is missed because original indicator can only look back one pivot and, consequently, misses the divergence between the next one back.
Please note, you may notice while using this script that some of the older divergences do not show any lines between the oscillator pivots. THIS IS NOT A BUG! In order to draw divergence lines properly for multiple pivots back, I had to use the line.new functions rather than plot functions. These line functions will delete old lines when a certain number have been drawn on the chart so these old ones are automatically erased as time passes.
發行說明
Added alerts for all divergences once per bar close or options to set each type of divergence alert individually. 發行說明
Added additional filter to only identify divergences when your oscillator is in overbought or oversold territory. You can also change this level to better suit your trading strategy or the particular oscillator you are using.發行說明
Added option to print divergences on price action instead of on the oscillator.發行說明
'Better Divs' just got even better. Never miss a divergence again.- My original revision (seen second from the bottom) was limited in the number of oscillator pivots it was able to scan for divergences. Here, I used arrays to store all previous pivot levels to allow the code to scan every pivot in within your chosen lookback range for divergence. (The Tradingview built in Divergence Indicator can be seen at the bottom for reference of differences)
- Plotting all of the divergence lines and labels can make the chart a little busy, so I've also added an option to either plot or hide the lines and labels.
- Option to scan for potential divergences so you don't miss your move. If you choose to plot these, they will print dashed divergence lines and transparent labels until they are either confirmed or invalidated. If confirmed, they will change to solid lines and opaque labels. If invalidated, they will simply be deleted from the chart.
- Plotting every single divergence line and label can make the chart very busy, so I added the option to either plot or hide them while providing alerts.
- Alert messages will include the type of divergence identified (potential or confirmed, bullish or bearish, regular or hidden) as well as the number of points of divergence identified on that bar.
- Finally, you can choose the maximum number of divergences to keep displayed on the chart. This is mainly to limit the number of items stored in the arrays to reduce memory usage and improve script efficiency.
As always, let me know if you have any questions or recommendations for improvements and happy trading!
發行說明
Fixed typo in 'Max Divs to Show' setting text發行說明
Overbought/Oversold filter back by popular demand: - 'Off' will identify any and every divergence.
- 'On' will require that the current oscillator value be in the overbought or oversold area, but have no restriction on where the divergence originates from.
- 'Strict' will limit divergences to only those where the oscillator value both originate from and finishes at an overbought or oversold value.
開源腳本
本著TradingView的真正精神,此腳本的創建者將其開源,以便交易者可以查看和驗證其功能。向作者致敬!雖然您可以免費使用它,但請記住,重新發佈程式碼必須遵守我們的網站規則。
Reach me on Twitter: @DoctaBot
Sign up for TradingView: tradingview.com/gopro/?share_your_love=federalPlayer66324
USDT (TRC20): TBELyC4PwYpKkdvNdr1iqE1j8abBijibqt
Sign up for TradingView: tradingview.com/gopro/?share_your_love=federalPlayer66324
USDT (TRC20): TBELyC4PwYpKkdvNdr1iqE1j8abBijibqt
免責聲明
這些資訊和出版物並不意味著也不構成TradingView提供或認可的金融、投資、交易或其他類型的意見或建議。請在使用條款閱讀更多資訊。