crasher

5x Period Cycle Seasonality

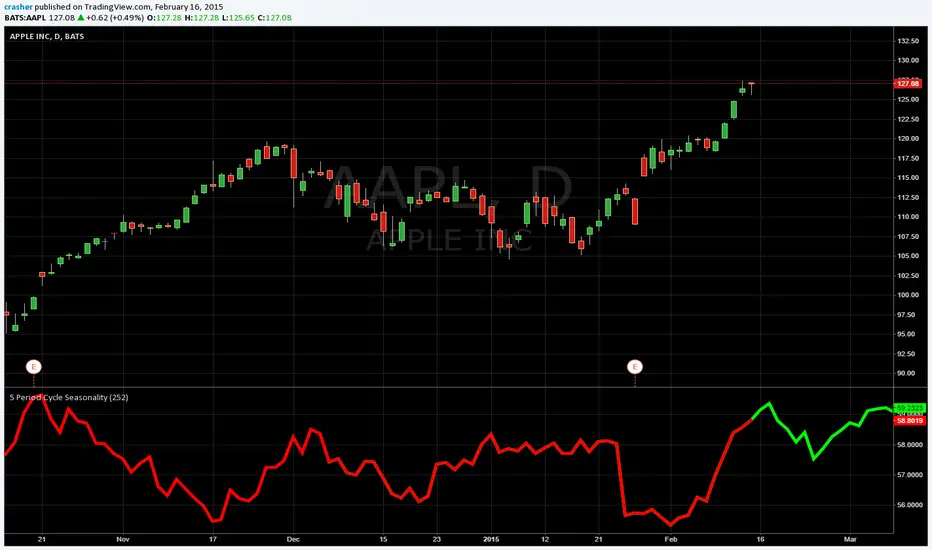
Shows the average from the last 5 periods for close price cycle. For example to see the annual seasonality of a stock for the last 5 years use on daily chart with the default setting of 252, the number of trading days in a year, approximately.

開源腳本

本著真正的TradingView精神,該腳本的作者將其開源發布,以便交易者可以理解和驗證它。為作者喝彩吧!您可以免費使用它,但在出版物中重複使用此代碼受網站規則的約束。 您可以收藏它以在圖表上使用。

免責聲明

這些資訊和出版物並不意味著也不構成TradingView提供或認可的金融、投資、交易或其他類型的意見或建議。請在使用條款閱讀更多資訊。

想在圖表上使用此腳本?
study("5 Period Cycle Seasonality")

Period = input(title="Period Cycle", type=integer , defval=252)

LastYear = close[Period]
TwoYearsAgo = close [2 * Period]
ThreeYearsAgo = close [3 * Period]
FourYearsAgo = close [4 *Period]
FiveYearsAgo = close [5 * Period]

Offset = Period
LastYearE = close[Period - Offset]
TwoYearsAgoE = close [2 * Period - Offset]
ThreeYearsAgoE = close [3 * Period - Offset]
FourYearsAgoE = close [4 *Period - Offset]
FiveYearsAgoE = close [5 * Period - Offset]

plot((LastYearE + TwoYearsAgoE + ThreeYearsAgoE + FourYearsAgoE + FiveYearsAgoE) / 5, color = #00ff00, linewidth = 5, offset =  Offset)

plot((LastYear + TwoYearsAgo + ThreeYearsAgo + FourYearsAgo + FiveYearsAgo) / 5, color = #ff0000, linewidth = 5)

相關想法