INVITE-ONLY SCRIPT
Average Gain/Loss
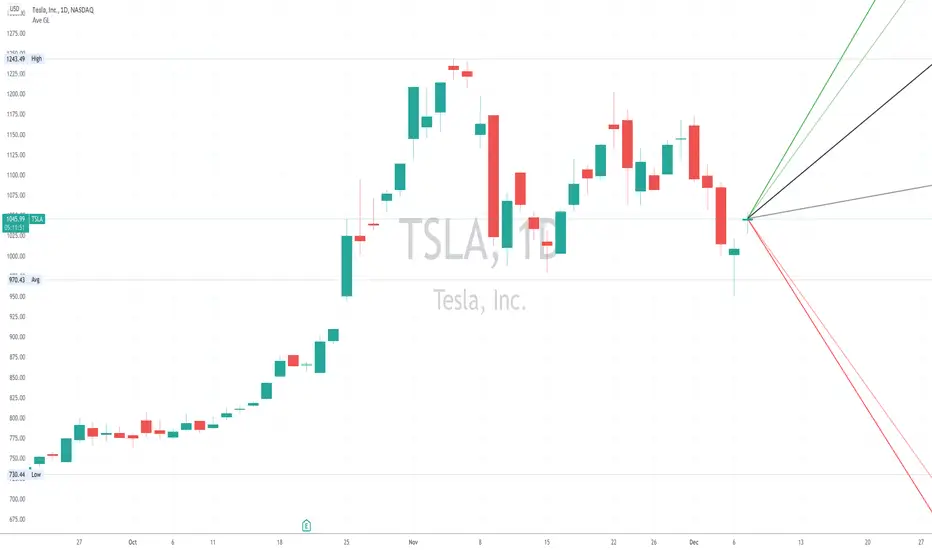
The Average Gain/Loss indicator adds rays to show what the average trade range might be for a given ticker based on historical data.
Green lines are the average gain, red lines are the average loss and black are the overall average.
Darker lines are the average of close to close and lighter lines are the candle averages.
Default average is set to 50 bars but is adjustable in settings.
Have modification ideas for this indicator? Just let me know and I will gladly consider them!
僅限邀請腳本
僅作者批准的使用者才能訪問此腳本。您需要申請並獲得使用許可,通常需在付款後才能取得。更多詳情,請依照作者以下的指示操作,或直接聯絡CaptainBrett。
TradingView不建議在未完全信任作者並了解其運作方式的情況下購買或使用腳本。您也可以在我們的社群腳本中找到免費的開源替代方案。
作者的說明
Submit your TradingView username here: https://forms.gle/WQbnG7zEBg5Zyb2b8
免責聲明
這些資訊和出版物並非旨在提供,也不構成TradingView提供或認可的任何形式的財務、投資、交易或其他類型的建議或推薦。請閱讀使用條款以了解更多資訊。