OPEN-SOURCE SCRIPT
已更新 Moving Average Convergence Divergence with Enhanced Cross Alerts
Overview of Features and Settings
- Customizable Parameters:
- Fast and Slow Periods: Users can set the duration for both the fast (default 12) and slow (default 26) moving averages.
- Source Selection: The indicator uses the closing price (close) by default, though this can be modified to any other data source.
- Signal Smoothing: The smoothing period for the signal line is adjustable (default 9), and you can choose whether to use SMA or EMA for both the oscillator and the signal line calculations.
Calculation Logic
1. Calculation of Moving Averages:
- The fast and slow moving averages are computed based on the chosen moving average type (SMA or EMA) over the specified periods.
- The MACD line is then determined as the difference between these two moving averages.
2. Signal Line and Histogram:
- Signal Line: Created by smoothing the MACD line, with the option to choose between SMA and EMA.
- Histogram: Represents the difference between the MACD line and the signal line, visually indicating the divergence between the two.
Detection of Cross Events
The script identifies two specific cross events with additional filtering conditions:
- Bullish Cross:
- The MACD line **crosses above** the signal line.
- The previous value of the histogram is negative, and both the MACD and the signal line are below zero.
- This condition suggests that a cross occurring in the negative territory might indicate a potential upward trend reversal.
- **Bearish Cross:**
- The MACD line **crosses below** the signal line.
- The previous value of the histogram is positive, and both the MACD and the signal line are above zero.
- This condition indicates that a cross in the positive territory may signal a potential downward trend reversal.
For each event, there are dedicated alert conditions defined that trigger notifications when the criteria are met.
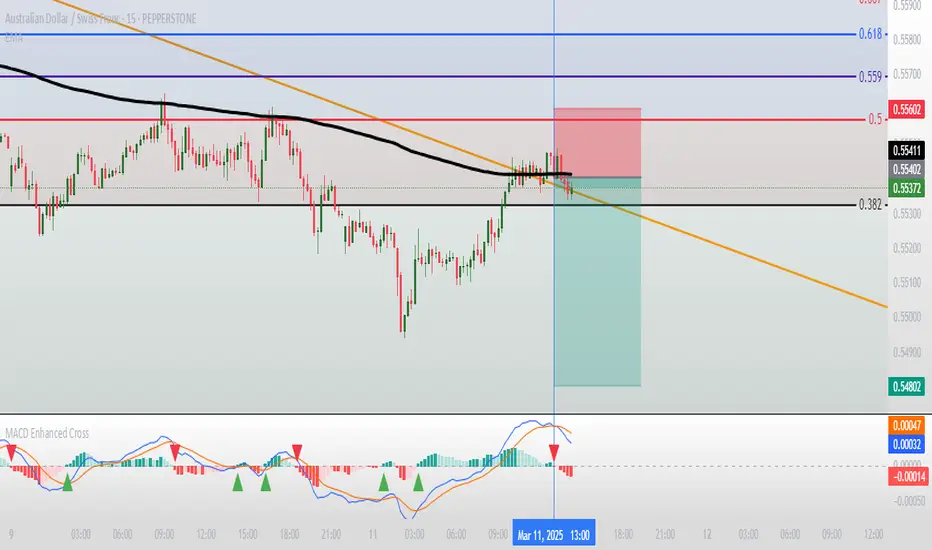
Visualization
- Displayed Elements:
- Histogram: Rendered as a column chart with colors that change based on the rate of change. For instance, a rising positive histogram uses a stronger green, whereas a declining positive histogram uses a lighter shade.
- MACD and Signal Lines: Displayed as separate lines with distinct colors to differentiate them.
- Zero Line: A horizontal line is drawn to help visually pinpoint the zero level.
- Crossing Signals:
- Optional markers in the form of arrows appear on the chart:
- **Bullish Cross: A green, upward-pointing triangle at the bottom.
- **Bearish Cross: A red, downward-pointing triangle at the top.
Summary
This indicator not only incorporates the traditional MACD components but also offers the following additional benefits:
- **Enhanced Accuracy:** Extra conditions (such as checking the previous histogram value and the position of the lines relative to zero) improve the identification of significant cross events.
- **Customization:** Users can personalize the moving average types and periods, making the indicator adaptable to different trading strategies.
- **Visual Assistance:** The combination of histogram columns, lines, and markers helps quickly pinpoint potential trend reversals, thereby aiding trading decisions.
This comprehensive description is intended to clearly demonstrate to users how the indicator works, outlining its calculations, filtering conditions, and its role in identifying cross events within technical analysis.
發行說明
...開源腳本
秉持TradingView一貫精神,這個腳本的創作者將其設為開源,以便交易者檢視並驗證其功能。向作者致敬!您可以免費使用此腳本,但請注意,重新發佈代碼需遵守我們的社群規範。
免責聲明
這些資訊和出版物並非旨在提供,也不構成TradingView提供或認可的任何形式的財務、投資、交易或其他類型的建議或推薦。請閱讀使用條款以了解更多資訊。
開源腳本
秉持TradingView一貫精神,這個腳本的創作者將其設為開源,以便交易者檢視並驗證其功能。向作者致敬!您可以免費使用此腳本,但請注意,重新發佈代碼需遵守我們的社群規範。
免責聲明
這些資訊和出版物並非旨在提供,也不構成TradingView提供或認可的任何形式的財務、投資、交易或其他類型的建議或推薦。請閱讀使用條款以了解更多資訊。