INVITE-ONLY SCRIPT
Stock Management (Zeiierman)
█ Overview
Stock Management (Zeiierman) gives investors a complete, real-time view of their portfolio directly inside TradingView. It tracks performance, allocation, volatility, and dividends in one unified interface, making it easy to understand both how your portfolio is performing and how it behaves in terms of risk and exposure.
Rather than analyzing each chart in isolation, Stock Management (Zeiierman) turns TradingView into a lightweight portfolio cockpit. You can define up to 20 stock positions (ticker, shares, average cost), and the tool will:
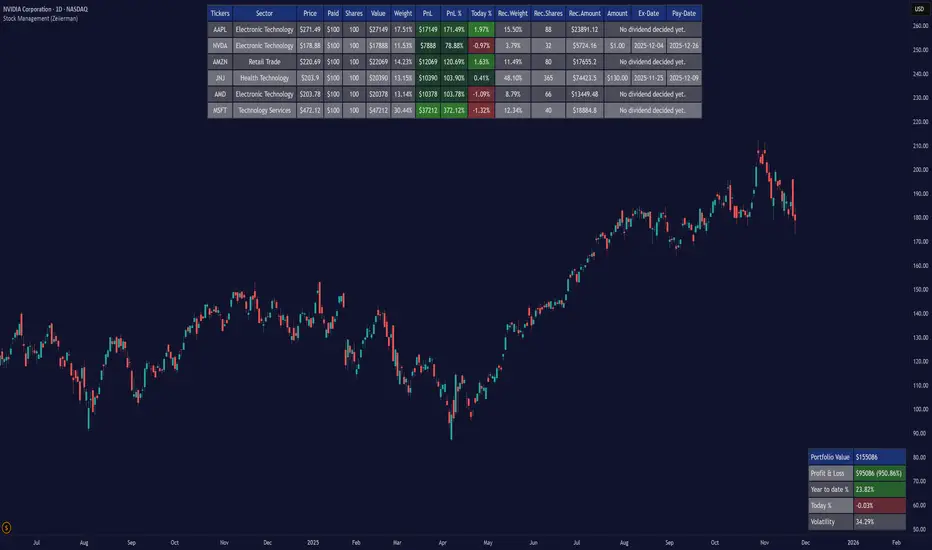
All of this appears as clean on-chart tables, including a main portfolio table, an optional dividend table, and an optional summary panel, allowing you to manage your portfolio while still watching price action. It is a visual portfolio layer built entirely around your own inputs, integrated seamlessly into the TradingView environment.

⚪ Why This One Is Unique
Most investors rely on basic broker dashboards that show position values but provide little insight into risk, exposure, or how each holding interacts with the rest of the portfolio. Stock Management (Zeiierman) goes far beyond that by building an intelligent, unified portfolio layer directly inside TradingView.
It automatically normalizes global holdings into a single reporting currency using live FX data, stabilizes allocation with a volatility-aware weighting engine, and structures your information through an adaptive column framework that highlights performance and risk in real time. A weighted summary blends portfolio movement, volatility, and long-horizon behavior into a clean snapshot, while dividend schedules and projected payouts are fully integrated into the same interface.
█ Main Features
⚪ 1. Portfolio Tracker
The core of Stock Management (Zeiierman) is a dynamic, real-time portfolio table that brings all key position data into one intelligent view. Each holding is displayed with:
The table updates continuously with market prices, giving investors an immediate understanding of performance, exposure, and risk across all positions.

⚪ 2. Dividend Information
Dividend data for your holdings is automatically fetched, organized, and presented alongside your positions. This includes dividend amount, ex-date, and pay-date, along with projected payouts based on your share count. All dividend-related information is integrated directly into the portfolio view, so you can plan cash flow without switching tools.

⚪ 3. Portfolio Summary
A dedicated summary panel consolidates the entire portfolio into a single snapshot: total value, total PnL, YTD %, today’s change, and overall volatility. The volatility reading is particularly valuable, providing a quick gauge of your portfolio’s risk level and how sensitive it may be to market movement.

⚪ 4. Portfolio Weight Recommendation
An intelligent weighting engine reviews your current allocations and highlights where your portfolio is overexposed or underweighted. It offers recommended allocation levels designed to reduce concentration risk and improve balance, giving you a clearer path toward a more stable long-term positioning.

█ How to Use
⚪ Performance Tracking
Quickly assess your entire portfolio’s profit, loss, daily movement, and volatility from one centralized dashboard. The summary panel gives you an instant read on how your holdings are performing and how sensitive they are to market swings.
⚪ Dividend Management
Monitor upcoming dividend amounts, ex-dates, and pay-dates directly inside your portfolio table. This ensures you never miss a payout opportunity and can plan your expected cash flow with complete clarity.
⚪ Risk Management & Optimization
Use portfolio-wide volatility and the intelligent Recommended Allocation engine to identify imbalances in your holdings. These insights help you adjust position sizes, reduce concentration risk, and maintain a more stable long-term portfolio profile.
⚪ Currency Comparison
Switch between different base currencies to evaluate performance in local or international terms. All positions are automatically normalized using live FX data, making global portfolio management effortless.
█ How It Works
Stock Management (Zeiierman) continuously gathers price, currency, dividend, and volatility data for every ticker you track. All values are automatically converted into your selected reporting currency, so global holdings remain comparable in one unified view.
It builds a live portfolio snapshot of each bar, updating position values, PnL, daily returns, YTD performance, and overall volatility. This gives you an always-current understanding of how your portfolio is performing and how each holding contributes to risk and exposure.
An intelligent, volatility-aware allocation model generates recommended portfolio weights and position sizes, helping you identify where you may be overexposed or underweighted. Dividend information is integrated directly into the table, projecting future payouts and highlighting upcoming ex-dates and pay-dates.
-----------------
Disclaimer
The content provided in my scripts, indicators, ideas, algorithms, and systems is for educational and informational purposes only. It does not constitute financial advice, investment recommendations, or a solicitation to buy or sell any financial instruments. I will not accept liability for any loss or damage, including without limitation any loss of profit, which may arise directly or indirectly from the use of or reliance on such information.
All investments involve risk, and the past performance of a security, industry, sector, market, financial product, trading strategy, backtest, or individual's trading does not guarantee future results or returns. Investors are fully responsible for any investment decisions they make. Such decisions should be based solely on an evaluation of their financial circumstances, investment objectives, risk tolerance, and liquidity needs.
Stock Management (Zeiierman) gives investors a complete, real-time view of their portfolio directly inside TradingView. It tracks performance, allocation, volatility, and dividends in one unified interface, making it easy to understand both how your portfolio is performing and how it behaves in terms of risk and exposure.
Rather than analyzing each chart in isolation, Stock Management (Zeiierman) turns TradingView into a lightweight portfolio cockpit. You can define up to 20 stock positions (ticker, shares, average cost), and the tool will:
- Normalize all positions into a single user-selected currency
- Calculate live position value, PnL, PnL%, and daily movement
- Compute total portfolio value, performance, and volatility
- Optionally generate a risk-parity style Recommended Allocation
- Display upcoming dividend amounts, ex-dates, and pay-dates for your holdings
All of this appears as clean on-chart tables, including a main portfolio table, an optional dividend table, and an optional summary panel, allowing you to manage your portfolio while still watching price action. It is a visual portfolio layer built entirely around your own inputs, integrated seamlessly into the TradingView environment.
⚪ Why This One Is Unique
Most investors rely on basic broker dashboards that show position values but provide little insight into risk, exposure, or how each holding interacts with the rest of the portfolio. Stock Management (Zeiierman) goes far beyond that by building an intelligent, unified portfolio layer directly inside TradingView.
It automatically normalizes global holdings into a single reporting currency using live FX data, stabilizes allocation with a volatility-aware weighting engine, and structures your information through an adaptive column framework that highlights performance and risk in real time. A weighted summary blends portfolio movement, volatility, and long-horizon behavior into a clean snapshot, while dividend schedules and projected payouts are fully integrated into the same interface.
█ Main Features
⚪ 1. Portfolio Tracker
The core of Stock Management (Zeiierman) is a dynamic, real-time portfolio table that brings all key position data into one intelligent view. Each holding is displayed with:
- Ticker
- Sector
- Price
- Average Paid Price
- Shares
- Position Value
- Position Weight
- Profit & Loss
- Profit & Loss %
- Today % Change
- Recommended Allocation
The table updates continuously with market prices, giving investors an immediate understanding of performance, exposure, and risk across all positions.
⚪ 2. Dividend Information
Dividend data for your holdings is automatically fetched, organized, and presented alongside your positions. This includes dividend amount, ex-date, and pay-date, along with projected payouts based on your share count. All dividend-related information is integrated directly into the portfolio view, so you can plan cash flow without switching tools.
⚪ 3. Portfolio Summary
A dedicated summary panel consolidates the entire portfolio into a single snapshot: total value, total PnL, YTD %, today’s change, and overall volatility. The volatility reading is particularly valuable, providing a quick gauge of your portfolio’s risk level and how sensitive it may be to market movement.
⚪ 4. Portfolio Weight Recommendation
An intelligent weighting engine reviews your current allocations and highlights where your portfolio is overexposed or underweighted. It offers recommended allocation levels designed to reduce concentration risk and improve balance, giving you a clearer path toward a more stable long-term positioning.
█ How to Use
⚪ Performance Tracking
Quickly assess your entire portfolio’s profit, loss, daily movement, and volatility from one centralized dashboard. The summary panel gives you an instant read on how your holdings are performing and how sensitive they are to market swings.
⚪ Dividend Management
Monitor upcoming dividend amounts, ex-dates, and pay-dates directly inside your portfolio table. This ensures you never miss a payout opportunity and can plan your expected cash flow with complete clarity.
⚪ Risk Management & Optimization
Use portfolio-wide volatility and the intelligent Recommended Allocation engine to identify imbalances in your holdings. These insights help you adjust position sizes, reduce concentration risk, and maintain a more stable long-term portfolio profile.
⚪ Currency Comparison
Switch between different base currencies to evaluate performance in local or international terms. All positions are automatically normalized using live FX data, making global portfolio management effortless.
█ How It Works
Stock Management (Zeiierman) continuously gathers price, currency, dividend, and volatility data for every ticker you track. All values are automatically converted into your selected reporting currency, so global holdings remain comparable in one unified view.
It builds a live portfolio snapshot of each bar, updating position values, PnL, daily returns, YTD performance, and overall volatility. This gives you an always-current understanding of how your portfolio is performing and how each holding contributes to risk and exposure.
An intelligent, volatility-aware allocation model generates recommended portfolio weights and position sizes, helping you identify where you may be overexposed or underweighted. Dividend information is integrated directly into the table, projecting future payouts and highlighting upcoming ex-dates and pay-dates.
-----------------
Disclaimer
The content provided in my scripts, indicators, ideas, algorithms, and systems is for educational and informational purposes only. It does not constitute financial advice, investment recommendations, or a solicitation to buy or sell any financial instruments. I will not accept liability for any loss or damage, including without limitation any loss of profit, which may arise directly or indirectly from the use of or reliance on such information.
All investments involve risk, and the past performance of a security, industry, sector, market, financial product, trading strategy, backtest, or individual's trading does not guarantee future results or returns. Investors are fully responsible for any investment decisions they make. Such decisions should be based solely on an evaluation of their financial circumstances, investment objectives, risk tolerance, and liquidity needs.
僅限邀請腳本
僅作者批准的使用者才能訪問此腳本。您需要申請並獲得使用許可,通常需在付款後才能取得。更多詳情,請依照作者以下的指示操作,或直接聯絡Zeiierman。
TradingView不建議在未完全信任作者並了解其運作方式的情況下購買或使用腳本。您也可以在我們的社群腳本中找到免費的開源替代方案。
作者的說明
Get instant access here: https://www.zeiierman.com/
Access my indicators at: zeiierman.com
Join Our Free Discord: discord.gg/zeiiermantrading
Join Our Free Discord: discord.gg/zeiiermantrading
免責聲明
這些資訊和出版物並非旨在提供,也不構成TradingView提供或認可的任何形式的財務、投資、交易或其他類型的建議或推薦。請閱讀使用條款以了解更多資訊。