PROTECTED SOURCE SCRIPT
OI Analysis (Smoothed + Pivots + OI Divergence)
Description
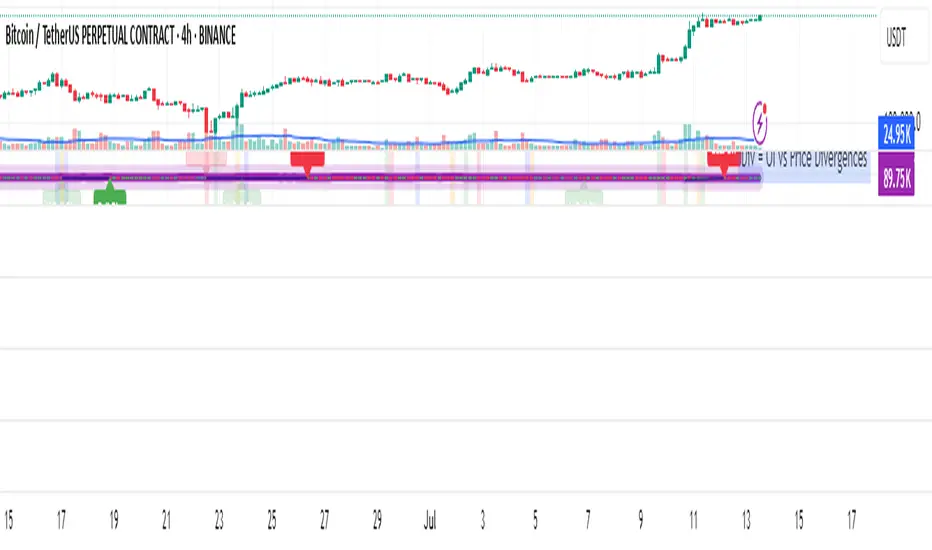
OI Pivot & Divergence Explorer is a multi-tool indicator for TradingView that blends Open Interest (OI) analysis with price action pivots and OI–price divergences. It helps you:
Visualize OI Trends: A thick, semi-transparent “glow” line shows smoothed OI changes, with a crisp center line for exact values.
Shade Momentum Scenarios: Background highlights flip between four market states—High Conviction, Squeeze, Bear Pressure, Liquidation—based on the confluence of price direction and OI spikes.
Detect Pivot Levels: Internally computes classic pivots on the OI series to mark potential turning points.
Spot OI-Price Divergences: Draws both regular and hidden bullish/bearish divergences between price pivots and corresponding OI pivots, connecting them with colored lines and labeling high-probability reversal setups.
Custom Alerts: Triggers alert conditions for each divergence type, so you can get notified of potentially actionable setups in real time.
Logic & Features
Inputs
Pivot Lookback (default 5): Number of bars on each side to qualify a pivot in both price and OI.
OI Change Smoothing (default 3) & OI Average Length (default 20): Control smoothing of raw OI delta and define the average band for threshold comparisons.
OI Change Threshold (%) (default 0.2%): Minimum relative OI change required to flag a “big” move.
Show OI Divergences (toggle on/off): Enable or disable drawing divergence lines and labels.
Scenario Shading
Computes raw OI delta → smoothed OI delta → compares against average OI.
Combines with price direction (up/down) to classify four states:
↑Price + ↑OI → High Conviction (green)
↑Price + ↓OI → Squeeze (orange)
↓Price + ↑OI → Bear Pressure (red)
↓Price + ↓OI → Liquidation (blue)
Shades the chart background only when the state flips.
Pivot Markers
Finds pivots on the OI series using the same lookback as price pivots.
(Pivot labels are removed from the visible pane; pivots now serve divergence logic.)
OI-Price Divergences
Regular Bullish: Price makes a lower low while OI makes a higher low.
Hidden Bullish: Price makes a higher low while OI makes a lower low.
Regular Bearish: Price makes a higher high while OI makes a lower high.
Hidden Bearish: Price makes a lower high while OI makes a higher high.
Connects each pivot pair with a thin line:
Regular uses dark navy
Hidden uses a lighter blue
Labels each divergence (“Bull Div,” “H Bull Div,” etc.) above or below the OI line for clarity.
How to Use
Add to Chart:
Open Pine Editor → paste the script → Save → “Add to Chart.”
Configure Inputs:
Adjust Pivot Lookback to match your timeframe: shorter (3–5) for intraday, longer (8–12) for daily/weekly.
Tweak OI Change Threshold to filter out noise or capture more subtle OI shifts.
Interpretation:
Background Color: Quick read on whether OI is reinforcing or diverging from price.
Divergence Lines: Look for regular divergences as early reversal signals; hidden divergences often indicate trend continuation or strong pullback entry points.
Alerts: Set up custom alerts on “Regular Bullish OI Divergence,” etc., to get popup/messages/notifications.
Best Practices:
Combine with your favorite price-based indicators (e.g. RSI, VWAP) for confluence.
Validate divergence signals against higher-timeframe pivots to avoid false breakouts.
Use in trending markets for continuation trades (hidden divergences) and in range markets for reversal setups (regular divergences).
受保護腳本
此腳本以閉源形式發佈。 However, you can use it freely and without any limitations – learn more here.
免責聲明
The information and publications are not meant to be, and do not constitute, financial, investment, trading, or other types of advice or recommendations supplied or endorsed by TradingView. Read more in the Terms of Use.