PROTECTED SOURCE SCRIPT
SZS Slow Stochastic
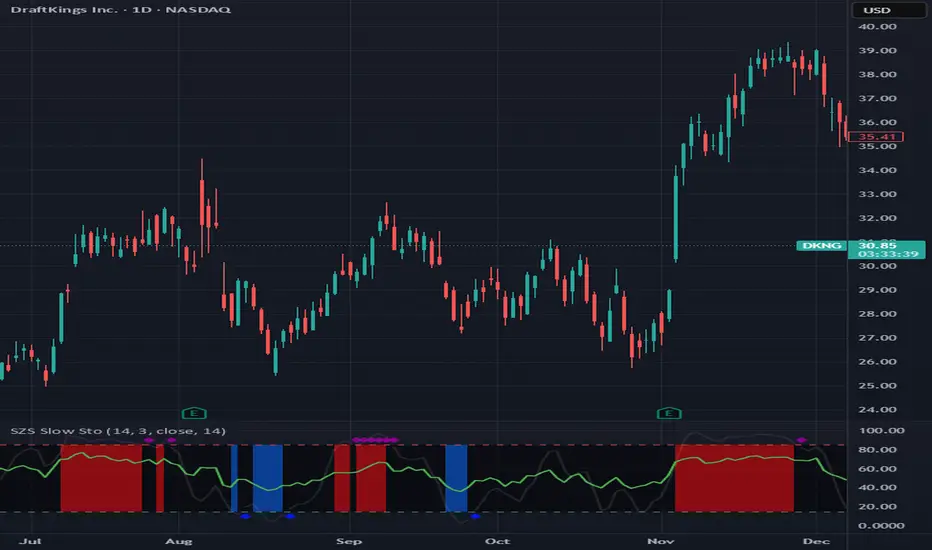
The SZS Slow Stochastic is a custom momentum indicator that blends the classic Slow Stochastic Oscillator with a dynamic RSI overlay and enhanced visual cues for overbought and oversold conditions.
This indicator helps identify potential trend reversals, momentum shifts, and exhaustion points in price movements.
Features
Slow Stochastic Calculation
Uses customizable %K and %D periods to measure momentum and potential turning points in price action.
%K Range: default 14
%D Period: default 3
Visual Extremes Highlighting
The plot line dynamically changes color to indicate:
🔴 Overbought Zone (%K ≥ 85)
🔵 Oversold Zone (%K ≤ 15)
⚪ Neutral Zone (between 15 and 85)
Diamond markers appear when %K exits the overbought/oversold regions to visually flag possible reversals.
RSI Momentum Overlay
The RSI (Relative Strength Index) is plotted alongside, colored based on recent momentum extremes:
🟢 RSI has touched above 75 within recent bars → bullish momentum bias
🔴 RSI has touched below 25 within recent bars → bearish momentum bias
Shaded Signal Zones
The area between the 85 and 15 levels is shaded according to current stochastic conditions:
Red shading → overbought pressure
Blue shading → oversold pressure
Alerts Ready
Upper and lower band crossing conditions are included for easy alert configuration.
Usage Tips
Look for color changes and diamond markers as potential early warnings of momentum reversals.
When both Stochastic and RSI show aligned signals (e.g. both indicating overbought or oversold), it strengthens the reversal or continuation signal.
Combine with price structure or volume indicators for higher confidence setups.
受保護腳本
此腳本以閉源形式發佈。 不過,您可以自由使用,沒有任何限制 — 點擊此處了解更多。
免責聲明
這些資訊和出版物並非旨在提供,也不構成TradingView提供或認可的任何形式的財務、投資、交易或其他類型的建議或推薦。請閱讀使用條款以了解更多資訊。
受保護腳本
此腳本以閉源形式發佈。 不過,您可以自由使用,沒有任何限制 — 點擊此處了解更多。
免責聲明
這些資訊和出版物並非旨在提供,也不構成TradingView提供或認可的任何形式的財務、投資、交易或其他類型的建議或推薦。請閱讀使用條款以了解更多資訊。