PROTECTED SOURCE SCRIPT
已更新 Market Stats
In this exciting new indicator...!
- You are able to select 6 different timeframes: 1 minute, 60 minute, 1 day, weekly, monthly, anything you please!
- With these timeframes, you are able to compare the different tema dema crossing percentages, to know whether the selected or current ticker is in an uptrend or downtrend!
- You are also able to formulate your very own EMA ratios to see in these different timeframes, or use the default, carefully optimized default EMA ratios per timeframe, to ultimately reveal the desired trends and whether these are in your favor for your position!
- Lastly, you have the RSI values at full display, also carefully optimized, for best alignment in indication of the current trend. To top it off, these RSI values are also displayed on the chart as well, should you choose to have it on display.
發行說明
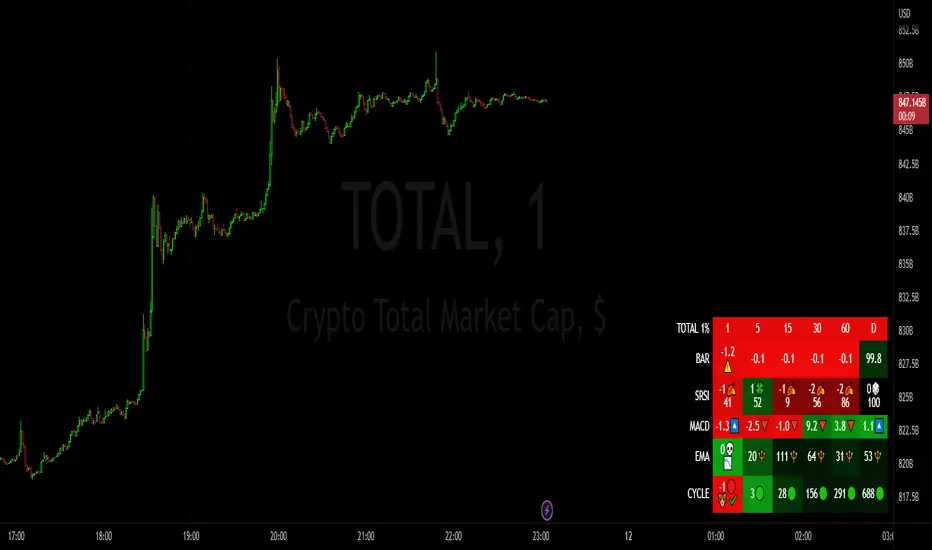
In V2 of this amazing indicator...!- Massive upgrade to increase consistency and quality of handling the indicator. Completely customizable rates for EMA, MACD, Bar Change Momentum, and indication for Cycles and Stochastic RSI. The idea is to consolidate all these different indications in percentage form to prevent having to switch between the many possible timeframes.
- The fundamental idea of this upgrade is to better discern upside and downside, this is achieved by two selectable colors (BULL and BEAR), and when a color is active, it is either brighter (which means new/ fresh/ continuation of a trend) or dimmer (deep in the given trend).
- Hovering over the table cells can offer additional data, particularly around the ticker title and the timeframe cell values, which present the total move for the current day, the distribution of bullish, bearish, and neutral values per cell and the gaps formed under the specified timeframes.
- A heatmap mode is offered to better focus on a general trend for the selected timeframes, based on color feedback alone. It is advised to maintain the default settings if intending to get a better feel of where the stock is headed.
- All in all, calculations for cycles and stochastic RSI are fixed, keeping in mind the most effective indication of potential direction change. Timeframes can be made to 1s, 1, 60, 120, 1D, 1w, 1M, or empty to match the current chart.
- ENJOY!!! CHEERS! Please share any additional feedback by sending me a direct message!
受保護腳本
此腳本以閉源形式發佈。 不過,您可以自由使用,沒有任何限制 — 點擊此處了解更多。
免責聲明
這些資訊和出版物並非旨在提供,也不構成TradingView提供或認可的任何形式的財務、投資、交易或其他類型的建議或推薦。請閱讀使用條款以了解更多資訊。
受保護腳本
此腳本以閉源形式發佈。 不過,您可以自由使用,沒有任何限制 — 點擊此處了解更多。
免責聲明
這些資訊和出版物並非旨在提供,也不構成TradingView提供或認可的任何形式的財務、投資、交易或其他類型的建議或推薦。請閱讀使用條款以了解更多資訊。