PROTECTED SOURCE SCRIPT
已更新 Bayesian predictive leading indicator
--------- ENGLISH ---------
This is a predictive indicator (leading indicator) that uses Bayes' formula to calculate the conditional probability of price increases given the angular coefficient. The indicator calculates the angular coefficient and its regression and uses it to predict prices.
Bayes' theorem is a fundamental result of probability theory and is used to calculate the probability of a cause causing the verified event. In other words, for our indicator, Bayes' theorem is used to calculate the conditional probability of one event (price event in this case) with respect to another event by calculating the probabilities of the two events (past price) and the conditional probability of the second event (future price) with respect to the first event.
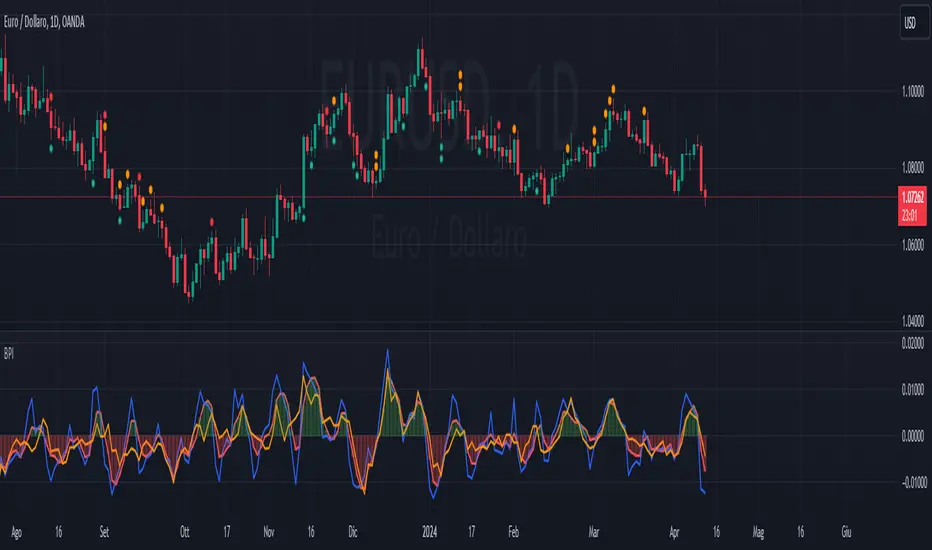
The red line represents the angular coefficient. The blue line represents the normalized expected price. Finally, the yellow line represents the conditional probability that the price will increase or decrease.
How to use it. In addition to the convenient histogram, which follows the angular coefficient, another practical operational application might be to go long when the blue line is above the red and yellow lines. Conversely short when the blue is below the red and yellow.
When the yellow line passes above all others, a reversal in the long direction is imminent and vice versa.
The extent of the reversal depends on how far the yellow line will be away in price from the other 2 lines.
This indicator is in its embryonic state and updates will follow to make it more graphically readable, add alerts, etc.
Stay tuned! Leave a boost and comment or write to me if you wish.
--------- ITALIANO ---------
Questo è un indicatore predittivo (leading indicator) che utilizza la formula di Bayes per calcolare la probabilità condizionata che il prezzo aumenti dato il coefficiente angolare. L’indicatore calcola il coefficiente angolare e la sua regressione e lo utilizza per prevedere i prezzi.
Il teorema di Bayes è un risultato fondamentale della teoria della probabilità e viene impiegato per calcolare la probabilità di una causa che ha provocato l’evento verificato. In altre parole, per il nostro indicatore, il teorema di Bayes serve per calcolare la probabilità condizionata di un evento (di prezzo in questo caso) rispetto a un altro evento, calcolando le probabilità dei due eventi (prezzo passato) e la probabilità condizionata del secondo evento (prezzo futuro) rispetto al primo.
La linea rossa rappresenta il coefficiente angolare. La linea blu rappresenta il prezzo previsto normalizzato. Infine la linea gialla rappresenta la probabilità condizionata che il prezzo aumenti o diminuisca.
Come si usa? Oltre al comodo istogramma, che segue il coefficiente angolare, un'altra applicazione operativa pratica potrebbe essere di andare long quando la linea blu è sopra la linea rossa e gialla. Viceversa short quando la blu è sotto la rossa e la gialla.
Quando la linea gialla passa sopra tutte le altre è imminente un'inversione in direzione long e viceversa.
L'entità dell'inversione dipende da quanto la linea gialla sarà distante di prezzo dalle altre 2 linee.
Questo indicatore è al suo stato embrionale e seguiranno aggiornamenti per renderlo graficamente più leggibile, aggiungere alert, ecc.
Stay tuned! Lascia un boost e commenta o scrivimi se desideri.
This is a predictive indicator (leading indicator) that uses Bayes' formula to calculate the conditional probability of price increases given the angular coefficient. The indicator calculates the angular coefficient and its regression and uses it to predict prices.
Bayes' theorem is a fundamental result of probability theory and is used to calculate the probability of a cause causing the verified event. In other words, for our indicator, Bayes' theorem is used to calculate the conditional probability of one event (price event in this case) with respect to another event by calculating the probabilities of the two events (past price) and the conditional probability of the second event (future price) with respect to the first event.
The red line represents the angular coefficient. The blue line represents the normalized expected price. Finally, the yellow line represents the conditional probability that the price will increase or decrease.
How to use it. In addition to the convenient histogram, which follows the angular coefficient, another practical operational application might be to go long when the blue line is above the red and yellow lines. Conversely short when the blue is below the red and yellow.
When the yellow line passes above all others, a reversal in the long direction is imminent and vice versa.
The extent of the reversal depends on how far the yellow line will be away in price from the other 2 lines.
This indicator is in its embryonic state and updates will follow to make it more graphically readable, add alerts, etc.
Stay tuned! Leave a boost and comment or write to me if you wish.
--------- ITALIANO ---------
Questo è un indicatore predittivo (leading indicator) che utilizza la formula di Bayes per calcolare la probabilità condizionata che il prezzo aumenti dato il coefficiente angolare. L’indicatore calcola il coefficiente angolare e la sua regressione e lo utilizza per prevedere i prezzi.
Il teorema di Bayes è un risultato fondamentale della teoria della probabilità e viene impiegato per calcolare la probabilità di una causa che ha provocato l’evento verificato. In altre parole, per il nostro indicatore, il teorema di Bayes serve per calcolare la probabilità condizionata di un evento (di prezzo in questo caso) rispetto a un altro evento, calcolando le probabilità dei due eventi (prezzo passato) e la probabilità condizionata del secondo evento (prezzo futuro) rispetto al primo.
La linea rossa rappresenta il coefficiente angolare. La linea blu rappresenta il prezzo previsto normalizzato. Infine la linea gialla rappresenta la probabilità condizionata che il prezzo aumenti o diminuisca.
Come si usa? Oltre al comodo istogramma, che segue il coefficiente angolare, un'altra applicazione operativa pratica potrebbe essere di andare long quando la linea blu è sopra la linea rossa e gialla. Viceversa short quando la blu è sotto la rossa e la gialla.
Quando la linea gialla passa sopra tutte le altre è imminente un'inversione in direzione long e viceversa.
L'entità dell'inversione dipende da quanto la linea gialla sarà distante di prezzo dalle altre 2 linee.
Questo indicatore è al suo stato embrionale e seguiranno aggiornamenti per renderlo graficamente più leggibile, aggiungere alert, ecc.
Stay tuned! Lascia un boost e commenta o scrivimi se desideri.
發行說明
Two types of alerts have been added: the buy signal given by the blue and red line above 0 for at least 2 consecutive candles (and vice versa). The buy signal given by the blue and red line above the yellow for at least 2 consecutive candles (and vice versa).受保護腳本
此腳本以閉源形式發佈。 不過,您可以自由且不受任何限制地使用它 — 在此處了解更多資訊。
免責聲明
這些資訊和出版物並不意味著也不構成TradingView提供或認可的金融、投資、交易或其他類型的意見或建議。請在使用條款閱讀更多資訊。
免責聲明
這些資訊和出版物並不意味著也不構成TradingView提供或認可的金融、投資、交易或其他類型的意見或建議。請在使用條款閱讀更多資訊。