INVITE-ONLY SCRIPT
已更新 TMFlow‴ | Trend Momentum Flow‴
Code Version
4
What does it do?
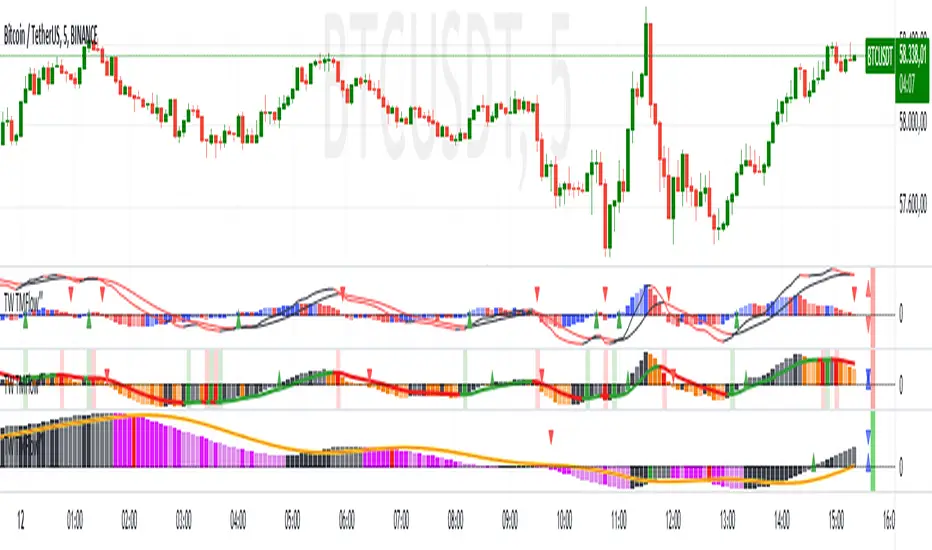
Converts MACD indicator into a powerfull long and short term trend momentum indicator. This is a 3in1 indicator, you have a (1) MACD or a (2) Long or (3) Short Termo Trend TMFlow indicator.
The chart presents a top TMFlow, this is the Long Term Trend TMFlow. The chart presents a bottom TMFlow, this is the Short Term Trend TMFlow, which provides you with pullback or long term trend reversal.
How does it work?
You can choose to use the TMFlow as a long term indicator that provides you with a long trend monitoring. If you choose to use the TMFlow as a short term momentum indicador, it will provide you with movement advance followed with a pullback movement, but this pullback could end up being a trend reversal in case it crosses the zero line which, in this case, will revert also the long term momentum trend (Long Term TMFlow mentioned above).
What's my filling?
definitively this is an indicator that MUST BE part of any trading system.
Indicator features:
- original MACD indicator;
- Long Term Trend TMFlow top/bottom wave reversal after a movement advance suggests long term trend reversal (signaled by bar color change);
- Short Term Trend TMFlow top/bottom wave reversal after a movement advance suggests pullback (signaled by bar color change) that could end up being a trend reversal in case it crosses under/above the zero line;
- TMFlow Moving Average Line that suggests 1st buy/sell sign once crossed by bar uptrend/downtrend, which is signaled by a blue/red bar;
- light green and red background bar provides with the histogram bar crossing above/under the TMFlow Moving Average Line, respectively;
- bar gradiant color to indicate acceleration or slowdown bars development;
To have access to this indicator, please DM me.
Don't contact me in the comment area.
4
What does it do?
Converts MACD indicator into a powerfull long and short term trend momentum indicator. This is a 3in1 indicator, you have a (1) MACD or a (2) Long or (3) Short Termo Trend TMFlow indicator.
The chart presents a top TMFlow, this is the Long Term Trend TMFlow. The chart presents a bottom TMFlow, this is the Short Term Trend TMFlow, which provides you with pullback or long term trend reversal.
How does it work?
You can choose to use the TMFlow as a long term indicator that provides you with a long trend monitoring. If you choose to use the TMFlow as a short term momentum indicador, it will provide you with movement advance followed with a pullback movement, but this pullback could end up being a trend reversal in case it crosses the zero line which, in this case, will revert also the long term momentum trend (Long Term TMFlow mentioned above).
What's my filling?
definitively this is an indicator that MUST BE part of any trading system.
Indicator features:
- original MACD indicator;
- Long Term Trend TMFlow top/bottom wave reversal after a movement advance suggests long term trend reversal (signaled by bar color change);
- Short Term Trend TMFlow top/bottom wave reversal after a movement advance suggests pullback (signaled by bar color change) that could end up being a trend reversal in case it crosses under/above the zero line;
- TMFlow Moving Average Line that suggests 1st buy/sell sign once crossed by bar uptrend/downtrend, which is signaled by a blue/red bar;
- light green and red background bar provides with the histogram bar crossing above/under the TMFlow Moving Average Line, respectively;
- bar gradiant color to indicate acceleration or slowdown bars development;
To have access to this indicator, please DM me.
Don't contact me in the comment area.
發行說明
Another great features that I forgot to mention are:- divergence line in the MACD indicator;
- divergence line in the Short Term Trend TMFlow indicator.
發行說明
This release provedes the same indicator but now with a menu settings much easier to use.Now it has a more intuitive interface.
發行說明
Quick update with formula minor change.發行說明
Just minor but important updates:1. the menu was reorganized with Titles
2. new Trend Line within the TMFlow Long period histogram
3. new histogram colors (Green and Red) within the TMFlow Long period histogram, therefore when the histogram crosses above the new Trend Line the indicator will plot a Green histogram, and when the histogram crosses under the new Trend Line the indicator will plot a Red histogram.
發行說明
Minor changes:1. script converted to PINE-5
2. indicator setup adjustment
3. menu simplified
僅限邀請腳本
僅作者批准的使用者才能訪問此腳本。您需要申請並獲得使用許可,通常需在付款後才能取得。更多詳情,請依照作者以下的指示操作,或直接聯絡MarceloTorres。
TradingView不建議在未完全信任作者並了解其運作方式的情況下購買或使用腳本。您也可以在我們的社群腳本中找到免費的開源替代方案。
作者的說明
To have access to this indicator, please DM me.
Don't contact me in the comment area.
TRADEWISER | Marcelo Torres
marcelo@tradewiser.pro
Vídeo-Análise completa diária no YouTube:
youtube.com/c/TradeWiserPro
Curso/AE
CursoAE.TradeWiser.pro
@TradeWiserPro
Telegram, Twitter, Facebook, LinkedIn, Instagram
marcelo@tradewiser.pro
Vídeo-Análise completa diária no YouTube:
youtube.com/c/TradeWiserPro
Curso/AE
CursoAE.TradeWiser.pro
@TradeWiserPro
Telegram, Twitter, Facebook, LinkedIn, Instagram
免責聲明
這些資訊和出版物並非旨在提供,也不構成TradingView提供或認可的任何形式的財務、投資、交易或其他類型的建議或推薦。請閱讀使用條款以了解更多資訊。