PROTECTED SOURCE SCRIPT
已更新 TRADE ORBIT : SCALPING STRATEGIES-1
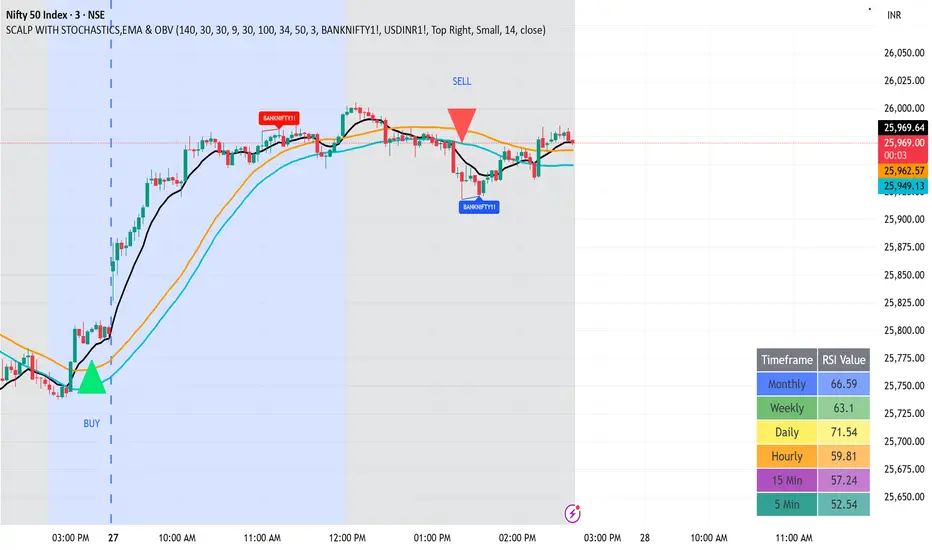
📘 Description – Stochastic + EMA/SMA + OBV Filtered Buy/Sell (First Signal Only)
This indicator combines Stochastic momentum, EMA/SMA trend filters, and OBV volume confirmation to generate high-quality first Buy/Sell signals after confirmed reversals.
🔍 Core Components
Stochastic (140,30,30):
When %K > %D → Blue background (bullish momentum)
When %K < %D → Black background (bearish momentum)
EMA/SMA Trend Filters:
EMA 9, EMA 30, EMA 100 → Identify short-, mid-, and long-term trend alignment.
SMA 34 (High/Low) → Define dynamic trend channel or range levels.
OBV (On-Balance Volume) Filter:
Calculates cumulative buying/selling pressure.
Buy condition: OBV > SMA(50) of OBV
Sell condition: OBV < SMA(50) of OBV
💡 Filtered Signal Logic
The script plots only the first Buy or Sell signal after a confirmed reversal.
Repeated signals in the same direction are suppressed until an opposite signal appears.
Helps reduce noise and false triggers during sideways markets.
🎨 Visual Elements
Background: Blue for bullish (%K > %D), Black for bearish (%K < %D).
Buy Signal: Green triangle below bar (first after bearish trend).
Sell Signal: Red triangle above bar (first after bullish trend).
Plots: EMA9 (yellow), EMA30 (teal), EMA100 (red), SMA34 High (orange), SMA34 Low (aqua).
🧭 Usage Tips
Look for Buy signals during blue backgrounds and when price is above EMA30/EMA100.
Look for Sell signals during black backgrounds and when price is below EMA30/EMA100.
Combine with higher-timeframe trend confirmation for stronger setups.
USE IN 3/5/10/15 MIN TIME FRAME
TARGET MIN 20 TO 30 POINT
發行說明
USE IN 3/5/10/15 MIN TIME FRAMETARGET MIN 20 TO 30 POINT
RSI TABLE AVAILABLE
受保護腳本
此腳本以閉源形式發佈。 不過,您可以自由且不受任何限制地使用它 — 在此處了解更多資訊。
免責聲明
這些資訊和出版物並不意味著也不構成TradingView提供或認可的金融、投資、交易或其他類型的意見或建議。請在使用條款閱讀更多資訊。
受保護腳本
此腳本以閉源形式發佈。 不過,您可以自由且不受任何限制地使用它 — 在此處了解更多資訊。
免責聲明
這些資訊和出版物並不意味著也不構成TradingView提供或認可的金融、投資、交易或其他類型的意見或建議。請在使用條款閱讀更多資訊。