INVITE-ONLY SCRIPT
已更新 G. Santostasi's Bimodal Regimes Power Law
G. Santostasi's Bimodal Regimes Power Law Model
Invite-Only TradingView Indicator
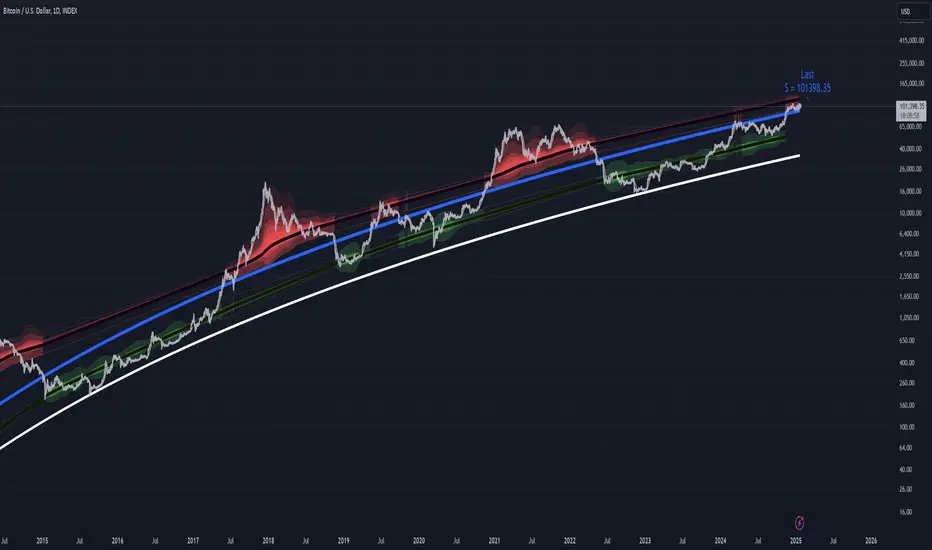
The Bimodal Power Law Model is a powerful TradingView indicator that provides a detailed visualization of Bitcoin's price behavior relative to its long-term power law trend. By leveraging volatility-normalized deviations, this model uncovers critical upper and lower bounds that govern Bitcoin’s price dynamics.
Key Features:
Power Law Support Line:
The model highlights the power law support line, a natural lower bound that has consistently defined Bitcoin's price floor over time. This line provides a crucial reference point for identifying accumulation zones.
Volatility-Normalized Upper Bound:
The indicator introduces a volatility-normalized upper channel, dynamically defined by the deviations from the power law. This bound represents the natural ceiling for Bitcoin’s price action and adjusts in real time to reflect changes in market volatility.
Color-Shaded Volatility Bounds:
The upper and lower bounds are visualized as color-shaded regions that represent the range of current volatility relative to the power law trend. These shaded regions dynamically expand or contract based on the level of market volatility, providing an intuitive view of Bitcoin’s expected price behavior under normalized conditions.
Two Regime Analysis:
Using a Gaussian Hidden Markov Model (HMM), the indicator separates Bitcoin's price action into two distinct regimes:
Above the power law:
Bullish phases characterized by overextensions.
Below the power law:
Bearish or accumulation phases where price consolidates below the trend.
Dynamic Bounds with Standard Deviations:
The model plots 2 standard deviation bands for both regimes, offering precise insights into the natural limits of Bitcoin’s price fluctuations. Peaks exceeding these bounds are contextualized as anomalies caused by historically higher volatility, emphasizing the consistency of normalized deviations.
Enhanced Visualization and Analysis:
The indicator integrates running averages calculated using deviations from the power law trend and smoothed volatility data to ensure a visually intuitive representation of Bitcoin’s price behavior. These insights help traders and researchers identify when price action is approaching statistically significant levels.
Use Cases:
Support and Resistance Identification:
Use the power law support line and upper volatility bounds to identify critical levels for buying or taking profit.
Cycle Analysis:
Distinguish between sustainable trends and speculative bubbles based on deviations from the power law.
Risk Management:
The shaded volatility regions provide a dynamic measure of risk, helping traders gauge when Bitcoin is overbought or oversold relative to its historical norms.
Market Timing: Understand Bitcoin’s cyclical behavior to time entries and exits based on its position within the shaded bounds.
Note:
This indicator is designed for long-term Bitcoin investors, researchers, and advanced traders who seek to leverage statistical regularities in Bitcoin’s price behavior. Available by invitation only.
Invite-Only TradingView Indicator
The Bimodal Power Law Model is a powerful TradingView indicator that provides a detailed visualization of Bitcoin's price behavior relative to its long-term power law trend. By leveraging volatility-normalized deviations, this model uncovers critical upper and lower bounds that govern Bitcoin’s price dynamics.
Key Features:
Power Law Support Line:
The model highlights the power law support line, a natural lower bound that has consistently defined Bitcoin's price floor over time. This line provides a crucial reference point for identifying accumulation zones.
Volatility-Normalized Upper Bound:
The indicator introduces a volatility-normalized upper channel, dynamically defined by the deviations from the power law. This bound represents the natural ceiling for Bitcoin’s price action and adjusts in real time to reflect changes in market volatility.
Color-Shaded Volatility Bounds:
The upper and lower bounds are visualized as color-shaded regions that represent the range of current volatility relative to the power law trend. These shaded regions dynamically expand or contract based on the level of market volatility, providing an intuitive view of Bitcoin’s expected price behavior under normalized conditions.
Two Regime Analysis:
Using a Gaussian Hidden Markov Model (HMM), the indicator separates Bitcoin's price action into two distinct regimes:
Above the power law:
Bullish phases characterized by overextensions.
Below the power law:
Bearish or accumulation phases where price consolidates below the trend.
Dynamic Bounds with Standard Deviations:
The model plots 2 standard deviation bands for both regimes, offering precise insights into the natural limits of Bitcoin’s price fluctuations. Peaks exceeding these bounds are contextualized as anomalies caused by historically higher volatility, emphasizing the consistency of normalized deviations.
Enhanced Visualization and Analysis:
The indicator integrates running averages calculated using deviations from the power law trend and smoothed volatility data to ensure a visually intuitive representation of Bitcoin’s price behavior. These insights help traders and researchers identify when price action is approaching statistically significant levels.
Use Cases:
Support and Resistance Identification:
Use the power law support line and upper volatility bounds to identify critical levels for buying or taking profit.
Cycle Analysis:
Distinguish between sustainable trends and speculative bubbles based on deviations from the power law.
Risk Management:
The shaded volatility regions provide a dynamic measure of risk, helping traders gauge when Bitcoin is overbought or oversold relative to its historical norms.
Market Timing: Understand Bitcoin’s cyclical behavior to time entries and exits based on its position within the shaded bounds.
Note:
This indicator is designed for long-term Bitcoin investors, researchers, and advanced traders who seek to leverage statistical regularities in Bitcoin’s price behavior. Available by invitation only.
發行說明
Improved the snapshot of the Indicator to give a better idea of visuals of the price action. 僅限邀請腳本
只有經作者授權的使用者才能訪問此腳本,且通常需付費。您可以將此腳本加入收藏,但需先向作者申請並獲得許可後才能使用 — 點擊此處了解更多。如需更多詳情,請依照作者說明或直接聯繫Quantonomyfund。
除非您完全信任其作者並了解腳本的工作原理,否則TradingView不建議您付費或使用腳本。您也可以在我們的社群腳本中找到免費的開源替代方案。
作者的說明
Please visit our website https://bitposeidon.com/power-law-indicators to signup for our Patreon program and Power Law Discord Group to get access to this and several other power law indicators.
提醒:在請求訪問權限之前,請閱讀僅限邀請腳本指南。
免責聲明
這些資訊和出版物並不意味著也不構成TradingView提供或認可的金融、投資、交易或其他類型的意見或建議。請在使用條款閱讀更多資訊。
僅限邀請腳本
只有經作者授權的使用者才能訪問此腳本,且通常需付費。您可以將此腳本加入收藏,但需先向作者申請並獲得許可後才能使用 — 點擊此處了解更多。如需更多詳情,請依照作者說明或直接聯繫Quantonomyfund。
除非您完全信任其作者並了解腳本的工作原理,否則TradingView不建議您付費或使用腳本。您也可以在我們的社群腳本中找到免費的開源替代方案。
作者的說明
Please visit our website https://bitposeidon.com/power-law-indicators to signup for our Patreon program and Power Law Discord Group to get access to this and several other power law indicators.
提醒:在請求訪問權限之前,請閱讀僅限邀請腳本指南。
免責聲明
這些資訊和出版物並不意味著也不構成TradingView提供或認可的金融、投資、交易或其他類型的意見或建議。請在使用條款閱讀更多資訊。