PROTECTED SOURCE SCRIPT
Pi Cycle Z-Score
Pi Cycle Z-Score
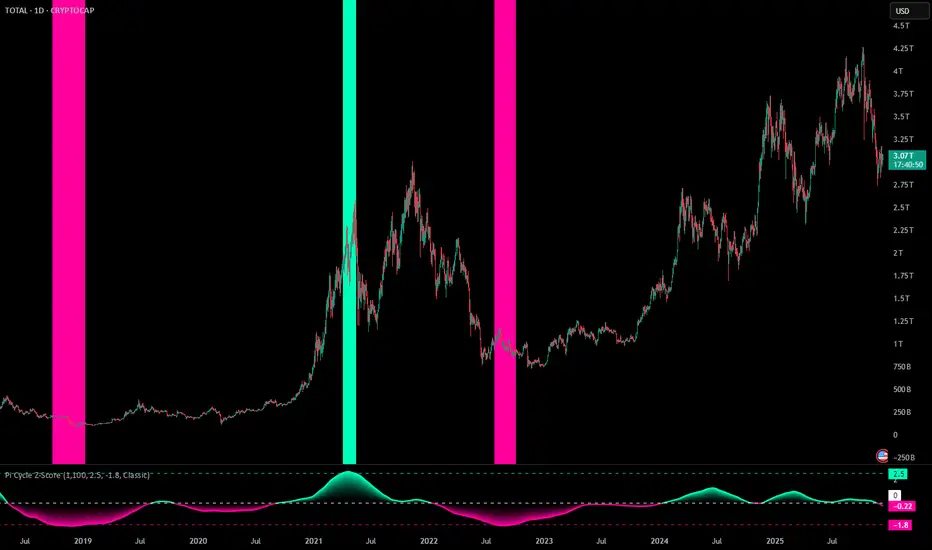
The Pi Cycle Top Indicator uses the 111 day moving average (111DMA) and a newly created multiple of the 350 day moving average, the 350DMA x 2 (the multiple is of the price values of the 350DMA, not the number of days). For the past three market cycles, when the 111DMA moves up and crosses the 350DMA x 2 we see that it coincides with the price of Bitcoin peaking. It is also interesting to note that 350 / 111 is 3.153, which is very close to Pi = 3.142, thus the name. Z-score analysis has been conducted to provide traders with a precise tool for identifying market extremes and potential reversions.
This indicator is calibrated on a weekly timeframe in order to give precise top and bottom signals for each cycle.
Features
The script compares the Z-score with customizable threshold levels to generate overbought and oversold levels. A Z-score exceeding the upper threshold suggests potential overbought conditions, while a Z-score below the lower threshold may indicate oversold conditions.
This script offers several customizable inputs, enabling traders to tailor the indicator to their preferences. The length determines the lookback period that the Z-score is calculated over. Traders can also adjust the thresholds to define the sensitivity of overbought and oversold conditions.
It has 10 available color schemes to choose from and the background coloring on the chart can be toggled on and off.
Practical Applications
This indicator is designed for traders who focus on identifying cycle extremes and potential mean reversion opportunities. By using Z-score analysis, this tool can be particularly effective for detecting points of overextension in the market, where a reversion to the mean is likely.
Detecting Overbought and Oversold Conditions: The Z-score measures how far the price has deviated from its norm, allowing traders to identify overbought or oversold conditions with precision.
Timing Market Reversals: The indicator provides early signals of potential market reversals by highlighting when the price has moved too far away from its average, helping traders anticipate reversion opportunities.
受保護腳本
此腳本以閉源形式發佈。 不過,您可以自由使用,沒有任何限制 — 點擊此處了解更多。
免責聲明
這些資訊和出版物並非旨在提供,也不構成TradingView提供或認可的任何形式的財務、投資、交易或其他類型的建議或推薦。請閱讀使用條款以了解更多資訊。
免責聲明
這些資訊和出版物並非旨在提供,也不構成TradingView提供或認可的任何形式的財務、投資、交易或其他類型的建議或推薦。請閱讀使用條款以了解更多資訊。