OPEN-SOURCE SCRIPT
已更新 Histogram Momentum Shaded Candles
Description:
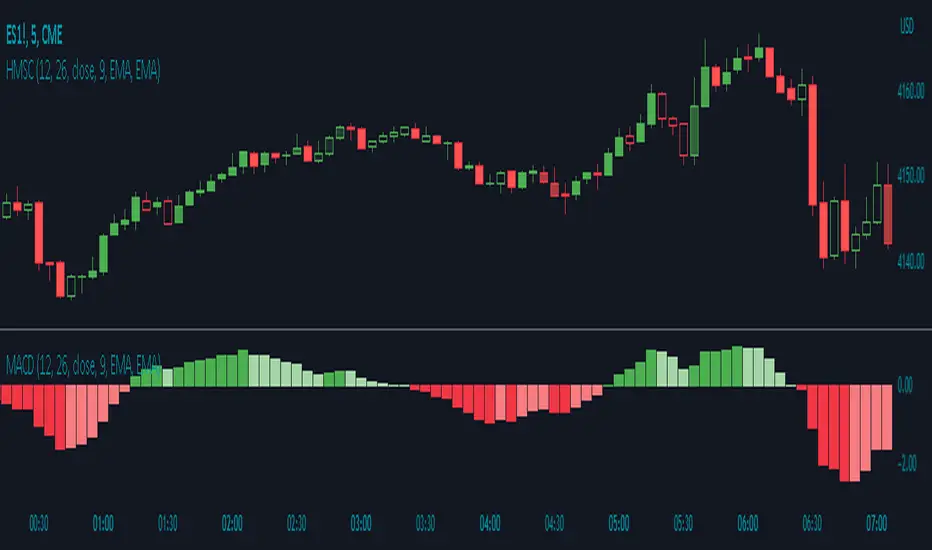
The Histogram Momentum Shaded Candles indicator (HMSC) is a powerful technical analysis tool that combines the concepts of the MACD (Moving Average Convergence Divergence) indicator and shaded candlestick visualization. It provides insights into momentum and trend strength by representing the MACD histogram as shaded candles on the chart.
How it Works:
The HMSC indicator calculates the MACD (Moving Average Convergence Divergence) using user-defined parameters such as the fast length, slow length, source, signal smoothing, and moving average types. It then calculates the MACD histogram by subtracting the signal line from the MACD line. The indicator transforms the histogram values into transparency levels for the shaded candles, representing bullish and bearish momentum.
Usage:
To effectively utilize the Histogram Momentum Shaded Candles indicator, follow these steps:
1. Apply the HMSC indicator to your chart by adding it from the available indicators.
2. Customize the MACD settings such as the fast length, slow length, source, signal smoothing, and moving average types according to your trading preferences.
3. Observe the shaded candles plotted on the chart:
- Bullish shaded candles (green by default) indicate positive momentum and potential buying pressure.
- Bearish shaded candles (red by default) indicate negative momentum and potential selling pressure.
4. Assess the intensity of the shaded candles:
5. Shading intensity is determined by the magnitude of the MACD histogram, with higher values resulting in more opaque candles.
6. The shading intensity reflects the strength of momentum and can help identify significant shifts in price action.
7. Combine the analysis of shaded candles with traditional candlestick patterns, trend lines, support and resistance levels, and other technical indicators to validate potential trade setups.
8. Implement appropriate risk management strategies, including setting stop-loss orders and position sizing, to manage your trades effectively and protect your capital.
發行說明
The calculations to the shading increments have been updated to be useable and move visible over any time period.發行說明
Default MACD histogram settings adjusted to the standard 12, 26, 9發行說明
The MACD indicator, with lines removed, has been added to the Histogram Momentum Shaded Candles chart image to allow users a visual representation of how the indicator functions without it needing to be applied.開源腳本
本著TradingView的真正精神,此腳本的創建者將其開源,以便交易者可以查看和驗證其功能。向作者致敬!雖然您可以免費使用它,但請記住,重新發佈程式碼必須遵守我們的網站規則。
免責聲明
這些資訊和出版物並不意味著也不構成TradingView提供或認可的金融、投資、交易或其他類型的意見或建議。請在使用條款閱讀更多資訊。
開源腳本
本著TradingView的真正精神,此腳本的創建者將其開源,以便交易者可以查看和驗證其功能。向作者致敬!雖然您可以免費使用它,但請記住,重新發佈程式碼必須遵守我們的網站規則。
免責聲明
這些資訊和出版物並不意味著也不構成TradingView提供或認可的金融、投資、交易或其他類型的意見或建議。請在使用條款閱讀更多資訊。