OPEN-SOURCE SCRIPT
Ehlers AutoCorrelation Indicator [CC]
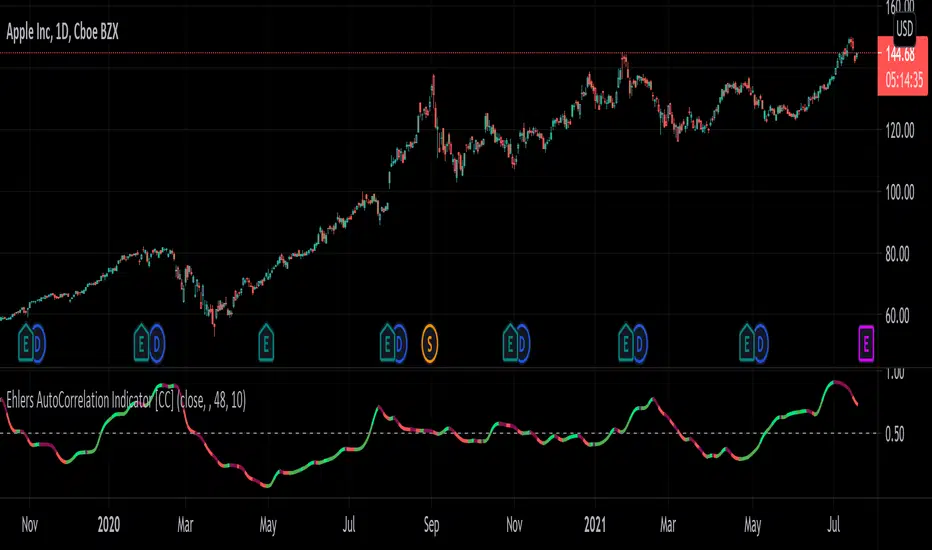
The AutoCorrelation Indicator was created by John Ehlers (Cycle Analytics pgs 94-98) and this can be viewed as both a momentum indicator and a trend indicator. This was his basis for several other indicators that he created which I will be publishing soon but essentially as this indicator goes up then the stock is in an uptrend and also has upward momentum. You will notice that this indicator starts to go down even during an uptrend showing that the underlying trend is going to have an upcoming reversal. He also warns that the halfway mark is a possible reversal point so keep an eye out for that.
Generally speaking a good signal is to enter a long position when the indicator is under the midline and is starting to go up (or when the line is green) and to exit the position when the indicator goes over the midline. I have included strong buy and sell signals in addition to normal ones so darker colors mean strong signals and lighter colors mean normal signals.
Let me know if there are any other indicators you would like me to publish!
開源腳本
本著TradingView的真正精神,此腳本的創建者將其開源,以便交易者可以查看和驗證其功能。向作者致敬!雖然您可以免費使用它,但請記住,重新發佈程式碼必須遵守我們的網站規則。
I created the largest stock indicator library:
github.com/ooples/
Custom Indicator Requests:
forms.gle/ouMffZR3dQ8bSJQG7
Tips are appreciated:
paypal.me/cheatcountry
patreon.com/cheatcountry
github.com/ooples/
Custom Indicator Requests:
forms.gle/ouMffZR3dQ8bSJQG7
Tips are appreciated:
paypal.me/cheatcountry
patreon.com/cheatcountry
免責聲明
這些資訊和出版物並不意味著也不構成TradingView提供或認可的金融、投資、交易或其他類型的意見或建議。請在使用條款閱讀更多資訊。