OPEN-SOURCE SCRIPT
已更新 Logarithmic Bollinger Bands [MisterMoTA]

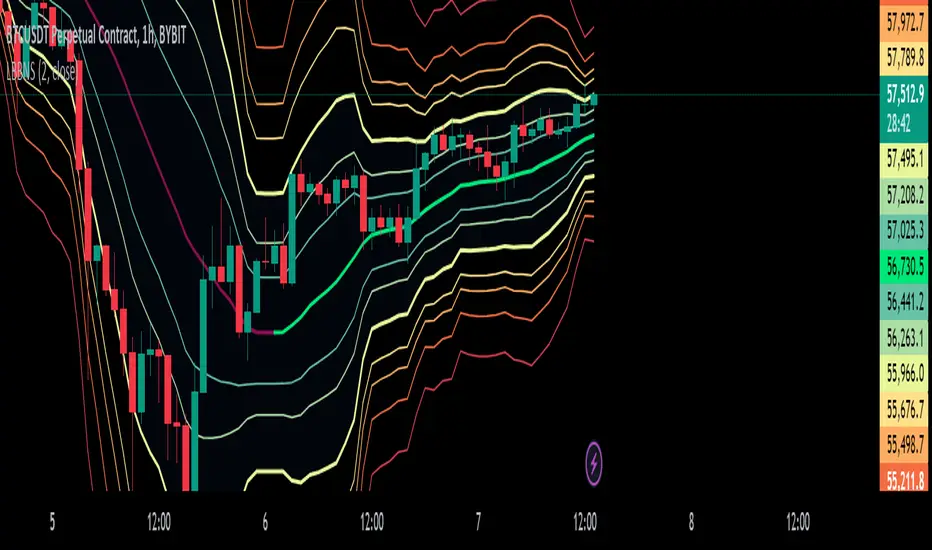
The script plot the normal top and bottom Bollinger Bands and from them and SMA 20 it finds fibonacci logarithmic levels where price can find temporary support/resistance.
To get the best results need to change the standard deviation to your simbol value, like current for BTC the Standards Deviation is 2.61, current Standard Deviation for ETH is 2.55.. etc.. find the right current standard deviation of your simbol with a search online.
The lines ploted by indicators are:
Let me know If you find the indicator useful or PM if you need any custom changes to it.
To get the best results need to change the standard deviation to your simbol value, like current for BTC the Standards Deviation is 2.61, current Standard Deviation for ETH is 2.55.. etc.. find the right current standard deviation of your simbol with a search online.
The lines ploted by indicators are:
- Main line is a 20 SMA
- 2 retracement Logarithmic Fibonacci 0.382 levels above and bellow 20 sma
- 2 retracement Logarithmic Fibonacci 0.618 levels above and bellow 20 sma
- Top and Bottom Bollindger bands (ticker than the rest of the lines)
- 2 expansion Logarithmic Fibonacci 0.382 levels above Top BB and bellow Bottom BB
- 2 expansion Logarithmic Fibonacci 0.618 levels above Top BB and bellow Bottom BB
- 2 expansion Logarithmic Fibonacci level 1 above Top BB and bellow Bottom BB
- 2 expansion Logarithmic Fibonacci 1.618 levels above Top BB and bellow Bottom BB
Let me know If you find the indicator useful or PM if you need any custom changes to it.
發行說明
- removed decimals and labels as Tradingview does a good job on displaying the labels on scales
- option to hide values on scales
- added color coded trend for 20 sma that can be disabled from dashboard
開源腳本
秉持TradingView一貫精神,這個腳本的創作者將其設為開源,以便交易者檢視並驗證其功能。向作者致敬!您可以免費使用此腳本,但請注意,重新發佈代碼需遵守我們的社群規範。
免責聲明
這些資訊和出版物並非旨在提供,也不構成TradingView提供或認可的任何形式的財務、投資、交易或其他類型的建議或推薦。請閱讀使用條款以了解更多資訊。
開源腳本
秉持TradingView一貫精神,這個腳本的創作者將其設為開源,以便交易者檢視並驗證其功能。向作者致敬!您可以免費使用此腳本,但請注意,重新發佈代碼需遵守我們的社群規範。
免責聲明
這些資訊和出版物並非旨在提供,也不構成TradingView提供或認可的任何形式的財務、投資、交易或其他類型的建議或推薦。請閱讀使用條款以了解更多資訊。