OPEN-SOURCE SCRIPT
已更新 [RD] Easy dynamic resolution dashboard
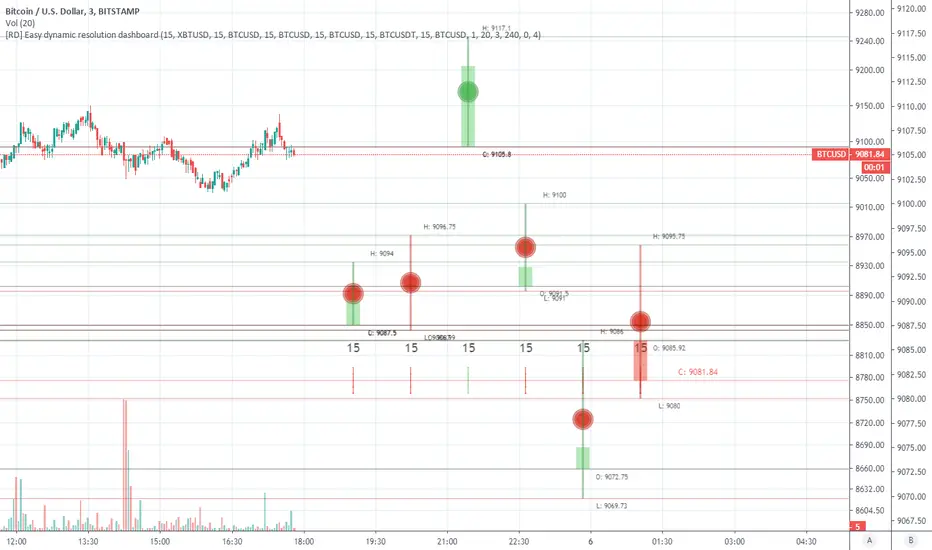
=== Easy dynamic resolution dashboard (initial) ===
Easy dashboard to show different running reolution bars most of the scale is adjustable.
Current state is initial and could have some bugs, or been in a cleaner way of coding. Let me know if you find something so we could fix it
Best way to start is in a seperate pane to adjust the you like best or most. Afterwards can copied to chart if needed
The round circle in the middle is the avg low|high price of that specifick candle in the resolution
Loading and input adjustments could take a while (reload)
You should get a warning if the current timeframe is higher then the input resolutions choosen. Adjust the reolutions according and you should be fine
Special thanks go to and borrowed some code from
- PineCoders
- RicardoSantos
Notes / Updates
- Let me know where it need (bug) fixes or adjustments
發行說明
Notes / Updates- Added possibility to different symbols on each resolution and abbility to make use of the current symbol
- Need some work on the alignment of the labels and text looks weird on different symbols and or tf's, needs to be generic
發行說明
Updated chartUpdate chart screenshot at the scripting section
發行說明
- quick hack to show each resolution on chart發行說明
Added another chart layout開源腳本
本著TradingView的真正精神,此腳本的創建者將其開源,以便交易者可以查看和驗證其功能。向作者致敬!雖然您可以免費使用它,但請記住,重新發佈程式碼必須遵守我們的網站規則。
免責聲明
這些資訊和出版物並不意味著也不構成TradingView提供或認可的金融、投資、交易或其他類型的意見或建議。請在使用條款閱讀更多資訊。
免責聲明
這些資訊和出版物並不意味著也不構成TradingView提供或認可的金融、投資、交易或其他類型的意見或建議。請在使用條款閱讀更多資訊。