INVITE-ONLY SCRIPT
已更新 FibPivot FluidTrades Pro

Educational Purpose only.
Trading Plan
⏰ Timeframe
Best suited for 15-minute for direction and signal or 5/1-minute for Ep chart intraday.
For swing trades, consider 4H or 1H.
✅ Trade Setup Conditions
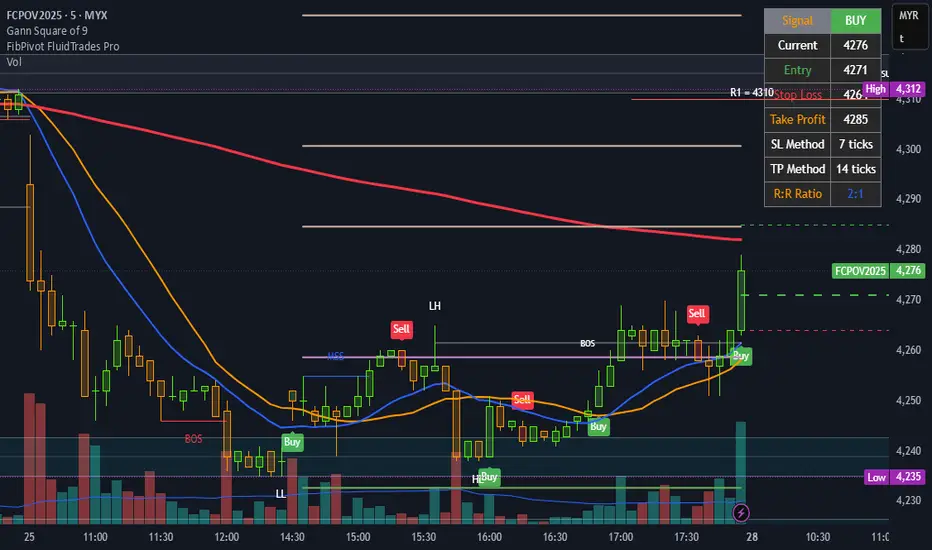
1. Market Structure Confirmation (MS, BOS, MSS)
Use BOS (Break of Structure) or MSS (Market Structure Shift) labels:
✅ Bullish Bias: Look for MSS/BOS up (price breaks previous swing high).
✅ Bearish Bias: Look for MSS/BOS down (price breaks previous swing low).
2. Supply & Demand Zones
Look for:
Demand box = long bias.
Supply box = short bias.
Avoid entering inside zones—wait for a retest/rejection or BOS out of zone.
3. Entry Signal
Buy Entry:
Green "Buy" shape appears. 50% of Candle
Price is above ATR trailing stop.
Signal appears near a demand zone, above MA200, and preferably above pivot level.
Sell Entry:
Red "Sell" shape appears. 50% of Candle
Price is below ATR trailing stop.
Signal appears near a supply zone, below MA200, and preferably below pivot level.
🧭 Confluences for Entry
Use 3+ of the following:
ATR trailing signal ✅
BOS/MSS ✅
Demand/Supply zone (fresh) ✅
Price above/below MA200 ✅
Close above/below pivot or Fib levels ✅
Candle breaks 50% of signal candle ✅
🎯 Entry, Stop Loss, Take Profit
Component Setting
Entry Midpoint of signal candle (auto drawn line)
Stop Loss Fixed 7 ticks (adjustable via settings)
Take Profit Fixed 14 ticks (default R:R = 2:1)
Trail Option ATR trailing stop (optional exit)
📉 Exit Strategy
Exit fully at TP line.
Or:
Partial at 1:1 (7 ticks).
Remainder at 2:1 (14 ticks).
Or trail with x ATRTrailingStop.
🚫 Avoid Trades When:
Price is inside supply/demand zones (indecision).
No BOS/MSS or weak structure.
Trading against MA200 slope/direction.
Entering near strong Fib pivot levels acting as support/resistance.
🔔 Alerts Available
Buy Signal (UT Long)
Sell Signal (UT Short)
BOS/MSS alerts (bull/bear)
🛠️ Risk Management
Risk only 1–2% of your capital per trade.
Follow the table display for low risk
Entry and Stop loss
TP
Risk-Reward Ratio (R:R)
Stick to predefined ticks for consistency.
📝 Example Trade Flow (Long):
MSS label (Bull) appears.
A Demand zone is drawn and respected.
Buy Signal appears above ATR trailing stop.
Price is above MA200.
Entry at midpoint of signal candle.
SL = -7 ticks, TP = +14 ticks.
P/S "I just wanted to say a big thank you to masterpiece FluidTrades SMC Lite script, clean, smart, and very useful. It helped me spot better entries and structure my trades properly.
發行說明
Update1僅限邀請腳本
僅作者批准的使用者才能訪問此腳本。您需要申請並獲得使用許可,通常需在付款後才能取得。更多詳情,請依照作者以下的指示操作,或直接聯絡amzoy068。
TradingView不建議在未完全信任作者並了解其運作方式的情況下購買或使用腳本。您也可以在我們的社群腳本中找到免費的開源替代方案。
作者的說明
As a tool to get high probability Entry Point with Stop Loss. Invite-only pine script and if interested please contact under sign @Fmcbr_Orb_Trader.
免責聲明
這些資訊和出版物並非旨在提供,也不構成TradingView提供或認可的任何形式的財務、投資、交易或其他類型的建議或推薦。請閱讀使用條款以了解更多資訊。
僅限邀請腳本
僅作者批准的使用者才能訪問此腳本。您需要申請並獲得使用許可,通常需在付款後才能取得。更多詳情,請依照作者以下的指示操作,或直接聯絡amzoy068。
TradingView不建議在未完全信任作者並了解其運作方式的情況下購買或使用腳本。您也可以在我們的社群腳本中找到免費的開源替代方案。
作者的說明
As a tool to get high probability Entry Point with Stop Loss. Invite-only pine script and if interested please contact under sign @Fmcbr_Orb_Trader.
免責聲明
這些資訊和出版物並非旨在提供,也不構成TradingView提供或認可的任何形式的財務、投資、交易或其他類型的建議或推薦。請閱讀使用條款以了解更多資訊。