INVITE-ONLY SCRIPT
Niteya BG Multi Indicator Multi Timeframe Scanner
Niteya BG Multi Indicator Multi Timeframe Scanner (NMIMTFS)
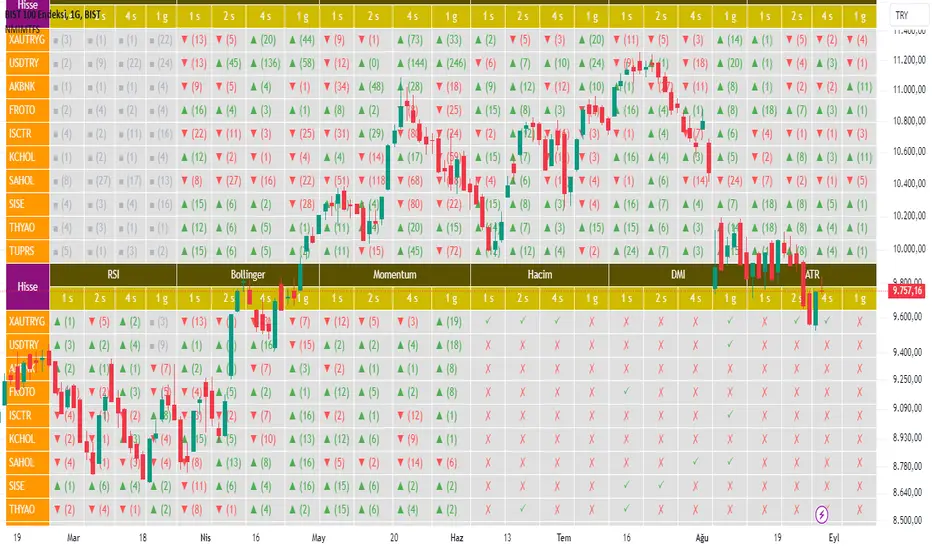
The indicator shows the values of 12 indicators in 4 different time intervals for 10 different tickers in a table.
bilgigunlugum.net/public/images/borsa/nmimtfs_table.png
You should set the chart timeframe to the value of the timeframe you selected that has the lowest value.
The main purpose of the indicator is to contribute to buy/sell decisions in a shorter time by providing access to the data without making any changes to the chart.
When you move the mouse over any cell on the table, you can see the details about the operation shown in that cell in an information window that opens:
Indicator features
Details
bilgigunlugum.net/borsa/pine_script/pine_script_indicator/nmimtfs
Türkçe açıklaması
Niteya BG Multi Indicator Multi Timeframe Scanner (NMIMTFS)
İndikatör, 10 farklı değer için, 12 indikatörün 4 farklı zaman aralığındaki değerlerini bir tabloda gösterir.
bilgigunlugum.net/public/images/borsa/nmimtfs_table.png
Grafik zaman aralığını, seçtiğiniz zaman aralıklarından en düşük değere sahip olanın değerine ayarlamalısınız.
İndikatörün temel amacı, grafikte değiklik yapmadan verilere erişim sğlayarak, daha kısa zamanda işlem için karar verilmesine katkı sağlamaktır.
Fareyi tablo üzerindeki herhangi bir hücrenin üzerine getirdiğinizde, o hücrede gösterilen işlemle ilgili detaylar açılan bir bilgi penceresinde gösterilir. Böylece, aşağıda gösterilen değerlere erişim sağlayabilirsiniz:
İndikatör özellikleri
Detaylar
bilgigunlugum.net/borsa/pine_script/pine_script_indicator/nmimtfs
The indicator shows the values of 12 indicators in 4 different time intervals for 10 different tickers in a table.
- EMA indicator
- KAMA indicator
- SuperTrend indicator
- Parabolic SAR indicator
- MACD indicator
- WaveTrend indicator
- RSI indicator
- Bollinger band indicator
- Momentum indicator
- Volume indicator
- DMI indicator
- ATR indicator
bilgigunlugum.net/public/images/borsa/nmimtfs_table.png
You should set the chart timeframe to the value of the timeframe you selected that has the lowest value.
The main purpose of the indicator is to contribute to buy/sell decisions in a shorter time by providing access to the data without making any changes to the chart.
When you move the mouse over any cell on the table, you can see the details about the operation shown in that cell in an information window that opens:
- The closing value and indicator values in the latest bar
- The status of the price and indicator values in the latest bar being larger or smaller than each other
- The trend status in the latest bar
- The date and time values where the price and indicator values cross each other
- The direction of the cross of the price and indicator values, level and bar index
Indicator features
- 4 time interval values can be changed.
- The input values of 12 indicators can be changed.
- The position of the indicator table on the chart can be changed.
- The ▲ sign in the table cells indicates an uptrend, the ▼ sign indicates a downtrend and the ■ sign indicates a neutral situation. The value in parentheses to the right of the signs indicates the bar index where the transaction took place.
- In the information window,
- The ↗ sign indicates that the value to the left of it intersects the value to the right of it upwards as many bars ago as the value in parentheses.
- The ↘ sign indicates that the value to the left of it intersects the value to the right of it downwards as many bars ago as the value in parentheses.
- The > sign indicates that the value on the left is greater than the value on the right by the value in parentheses.
- The + and - signs indicate the level of the indicators for WaveTrend, RSI and Bollinger indicators.
- Green colors indicate an uptrend and positive results, while red colors indicate a downtrend and negative results.
Details
bilgigunlugum.net/borsa/pine_script/pine_script_indicator/nmimtfs
Türkçe açıklaması
Niteya BG Multi Indicator Multi Timeframe Scanner (NMIMTFS)
İndikatör, 10 farklı değer için, 12 indikatörün 4 farklı zaman aralığındaki değerlerini bir tabloda gösterir.
- EMA indikatörü
- KAMA indikatörü
- SuperTrend indikatörü
- Parabolic SAR indikatörü
- MACD indikatörü
- WaveTrend indikatörü
- RSI indikatörü
- Bollinger bant indikatörü
- Momentum indikatörü
- Hacim indikatörü
- DMI indikatörü
- ATR indikatörü
bilgigunlugum.net/public/images/borsa/nmimtfs_table.png
Grafik zaman aralığını, seçtiğiniz zaman aralıklarından en düşük değere sahip olanın değerine ayarlamalısınız.
İndikatörün temel amacı, grafikte değiklik yapmadan verilere erişim sğlayarak, daha kısa zamanda işlem için karar verilmesine katkı sağlamaktır.
Fareyi tablo üzerindeki herhangi bir hücrenin üzerine getirdiğinizde, o hücrede gösterilen işlemle ilgili detaylar açılan bir bilgi penceresinde gösterilir. Böylece, aşağıda gösterilen değerlere erişim sağlayabilirsiniz:
- En son bardaki kapanış değeri ve indikatör değerleri
- En son bardaki fiyat ve indikatör değerlerinin birbirine göre büyük ve küçük olma durumu
- En son bardaki trend durumu
- Fiyat ve indikatör değerlerinin kesiştiği tarih ve zaman değerleri
- Fiyat ve indikatör değerlerinin kesişme yönü, seviyesi ve bar endeksi
İndikatör özellikleri
- 4 zaman aralığı değeri değiştirilebilir.
- 12 indikatörün giriş değerleri değiştirilebilir.
- İndikatör tablosunun grafik üzerindeki konumu değiştirilebilir.
- Tablo hücrelerindeki ▲ işareti yükseliş trendini, ▼ işareti düşüş trendini ve ■ işareti nötr durumu ifade eder. İşaretlerin sağında parantez içinde yer alan değer ise işlemin gerçekleştiği bar endeksini göstermektedir.
- İpucu pencerelerinde,
- ↗ işareti solundaki değerin sağındaki değeri parantez içindeki değer kadar bar önce yukarı doğru kestiğini gösterir.
- ↘ işareti solundaki değerin sağındaki değeri parantez içindeki değer kadar bar önce aşağı doğru kestiğini gösterir.
- > işareti solundaki değerin sağındaki değerden parantez içindeki değer kadar bar önce daha büyük bir değer aldığını gösterir.
- + ve - işareti, WaveTrend, RSI ve Bollinger indikatörleri için, indikatörlerin seviyesini gösterir.
- Yeşil renkler yükseliş trendini ve olumlu sonuçları, kırmızı renkler ise düşüş trendini ve olumsuz sonuçları gösterir.
Detaylar
bilgigunlugum.net/borsa/pine_script/pine_script_indicator/nmimtfs
僅限邀請腳本
只有經作者授權的使用者才能訪問此腳本,且通常需付費。您可以將此腳本加入收藏,但需先向作者申請並獲得許可後才能使用 — 點擊此處了解更多。如需更多詳情,請依照作者說明或直接聯繫Niteya。
請注意,此私人、僅限邀請的腳本尚未經過腳本管理員審核,其是否符合社群規範尚無定論。 除非您完全信任其作者並了解腳本的工作原理,否則TradingView不建議您付費或使用腳本。您也可以在我們的社群腳本中找到免費的開源替代方案。
作者的說明
Users can request access to the indicator via the e-mail address info@bilgigunlugum.net.
Kullanıcılar indikatöre erişim için info@bilgigunlugum.net e-posta adresinden talepte bulunabilirler.
提醒:在請求訪問權限之前,請閱讀僅限邀請腳本指南。
免責聲明
這些資訊和出版物並不意味著也不構成TradingView提供或認可的金融、投資、交易或其他類型的意見或建議。請在使用條款閱讀更多資訊。