OPEN-SOURCE SCRIPT
已更新 Envelope Momentum Cloud
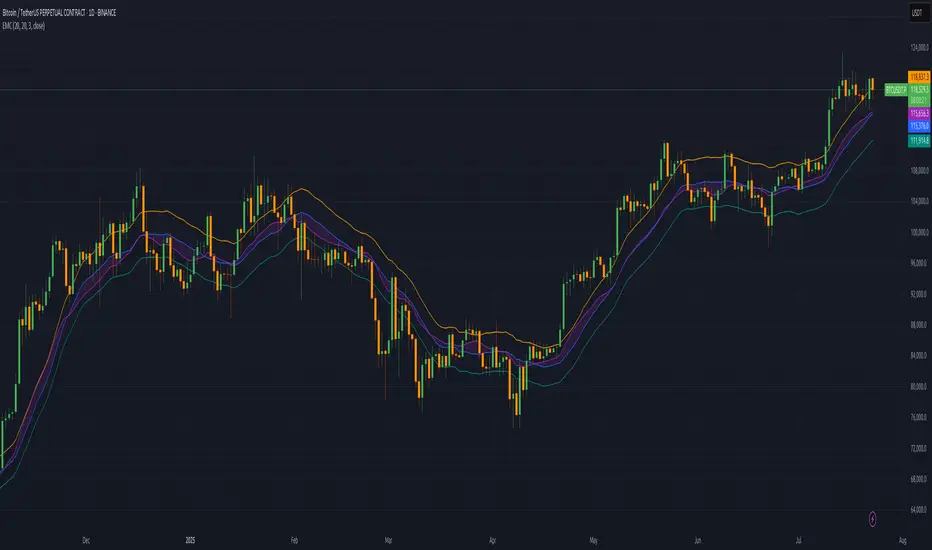
Envelope Momentum Cloud (EMC) is a momentum visualization tool using moving averages and fixed-percentage envelopes. It compares an EMA (fast) to an SMA (slow), with static envelopes around the SMA to create momentum thresholds.
SMA anchors the trend baseline.
EMA highlights momentum shifts relative to the SMA.
Envelopes are placed at a user-defined % above and below the SMA.
Momentum Cloud visually fills the gap between EMA and SMA to show directional pressure.
Crosses beyond the envelope boundaries can indicate overextended moves or possible trend shifts.
發行說明
Envelope Momentum Cloud (EMC) is a trading indicator designed to help visualize momentum using averages. This script compares two main types of averages: the Simple Moving Average (SMA) and the Exponential Moving Average (EMA). Here's a breakdown of each component and its function:Simple Moving Average (SMA): The SMA calculates the average closing price over a defined number of days. It serves as the baseline for the envelopes and helps in establishing the context for comparing the EMA.
Exponential Moving Average (EMA): The EMA prioritizes more recent prices by applying greater weight to them. This responsiveness makes it an excellent tool for tracking price momentum. In this indicator, the EMA’s relationship with the SMA indicates potential momentum shifts.
Envelopes (Upper and Lower Bounds): The upper and lower envelopes are set around the SMA by a user-defined percentage. These envelopes create a threshold for assessing the EMA’s momentum. If the EMA crosses one of these thresholds it suggests a potential momentum shift.
Momentum Cloud: The area between the EMA and SMA is shaded to represent the 'Momentum Cloud.' If the EMA is above the SMA, or on of it's derivatives it may indicate upward momentum and vice versa depending on the context of the situation.
開源腳本
本著TradingView的真正精神,此腳本的創建者將其開源,以便交易者可以查看和驗證其功能。向作者致敬!雖然您可以免費使用它,但請記住,重新發佈程式碼必須遵守我們的網站規則。
免責聲明
這些資訊和出版物並不意味著也不構成TradingView提供或認可的金融、投資、交易或其他類型的意見或建議。請在使用條款閱讀更多資訊。
開源腳本
本著TradingView的真正精神,此腳本的創建者將其開源,以便交易者可以查看和驗證其功能。向作者致敬!雖然您可以免費使用它,但請記住,重新發佈程式碼必須遵守我們的網站規則。
免責聲明
這些資訊和出版物並不意味著也不構成TradingView提供或認可的金融、投資、交易或其他類型的意見或建議。請在使用條款閱讀更多資訊。