OPEN-SOURCE SCRIPT
Moving Average of Volume for Up and Down Closes
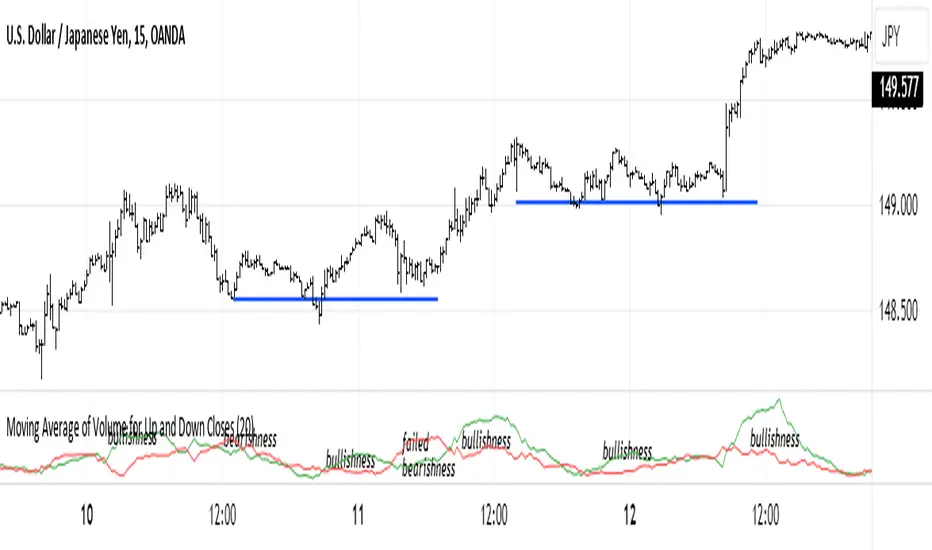
This indicator is intended to provide market bias information at a glance. Depending on the number of periods selected it can help identify changes in buying and selling sentiment or overall market bias. The two lines indicate increases and decreases in volumes for the selected number of periods. I recommend using this indicator with a minimum of clear support and resistance lines and a standard volume indicator. It does provided useful information as a stand-alone indicator. I don't use any indicators except volume, so this was meant to be my own personal volume analysis tool, however I feel that it can be very useful for other traders who may not have a deep understanding of volume analysis.
開源腳本
秉持TradingView一貫精神,這個腳本的創作者將其設為開源,以便交易者檢視並驗證其功能。向作者致敬!您可以免費使用此腳本,但請注意,重新發佈代碼需遵守我們的社群規範。
免責聲明
這些資訊和出版物並非旨在提供,也不構成TradingView提供或認可的任何形式的財務、投資、交易或其他類型的建議或推薦。請閱讀使用條款以了解更多資訊。
免責聲明
這些資訊和出版物並非旨在提供,也不構成TradingView提供或認可的任何形式的財務、投資、交易或其他類型的建議或推薦。請閱讀使用條款以了解更多資訊。