PROTECTED SOURCE SCRIPT
EW Convergence HUD (Pane) — v2.2.5
📖 Description
The EW Convergence Suite is a dual-component Elliott-Wave inspired tool designed to help traders spot multi-timeframe convergence points — the places where waves across different timeframes terminate together and trend changes often ignite.
It contains two parts:
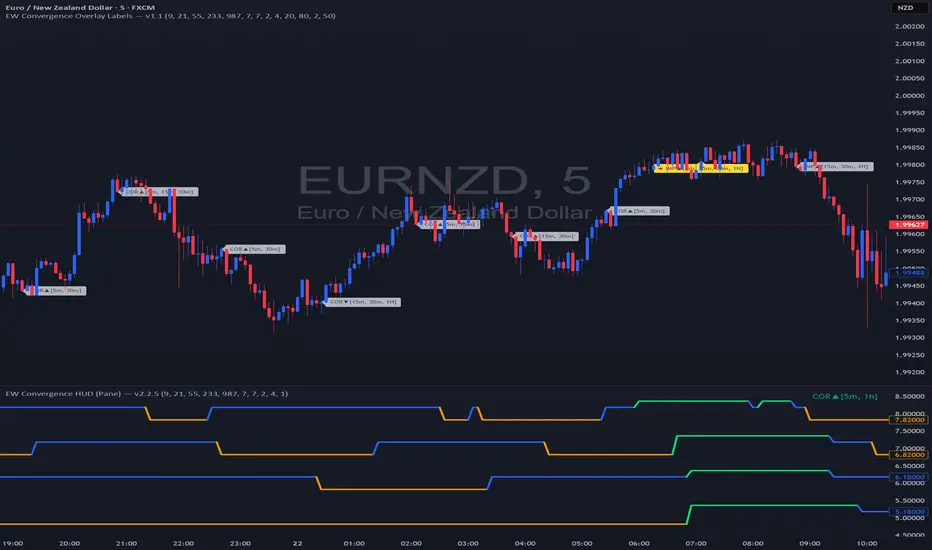
🔹 HUD (Pane)
Lives in the lower pane, one horizontal row per timeframe (1m → 1M).
Colors represent phase classification:
Lime = Impulse Up (+2)
Red = Impulse Down (−2)
Teal = Corrective Up (+1)
Orange = Corrective Down (−1)
Gray = Neutral/Unclear
Rows shift slightly up/down depending on impulse vs. corrective, so you can see transitions as diagonal “jumps.”
HUD ticker (top-right) shows current convergence state:
Example: IMP▲[5m,15m,1h] = impulse up alignment on 3 TFs.
Example: ★ COR▼[30m,1h,4h,1d] = 4 TF corrective down alignment (special event).
🔹 Overlay Labels (on price chart)
Prints labels directly on the chart when convergence events meet your thresholds.
Shows which phases and which TFs are aligned at that moment.
Optional pivot confirmation:
Early mode → labels fire as soon as TFs align (onlyOnPivot=false).
Confirmed mode → labels fire only when convergence + a fresh pivot confirmation occur (onlyOnPivot=true + pivot lines on).
Can also draw multi-TF pivot lines to visually connect swing highs/lows across your chosen timeframes.
⚙️ Inputs & Customization
Timeframe Toggles → select which TFs to include in the convergence counts.
EMA Trend Stack (9/21/55/233/987 by default) → defines trend alignment for impulse vs. corrective classification.
Pivot left/right → sensitivity of swing highs/lows (2/2 = fast, 5/5 = smoother, 10/10+ = major swings).
MinN / SpecialN → thresholds for convergence events (regular vs. ★ special highlight).
Label Controls →
Only on pivot confirmations
Only on confirmed bars
Only when content changes
Minimum bar gap between labels
Wave Line Controls → toggle pivot-connecting lines per TF, with adjustable opacity and max lines stored.
🎯 How to Use
Scan the HUD for clusters of rows with the same color/phase. Flat plateaus across multiple TFs = strong alignment.
Wait for convergence counts (MinN or SpecialN) to be reached. HUD ticker will show IMP▲ or COR▼ with the TF list.
Watch the Overlay Labels on the price chart for where that convergence “hits” — optionally tied to fresh pivot confirmations.
Best practice:
Use lower TFs (1m/5m/15m) as entry triggers.
Use higher TFs (1h/4h/1D) as bias anchors.
Look for termination zones where both HUD alignment and Overlay labels agree.
🔑 Why it works
This indicator combines objective pivot detection with EMA-based trend structure to classify legs as impulsive or corrective. By watching multiple TFs simultaneously, it highlights the rare and powerful moments where waves across scales converge. These are often the cleanest points for entry, exit, or scaling.
Impulse convergence → continuation or breakout potential.
Corrective convergence → likely end of a pullback and resumption of higher-TF trend.
Pivot-gated mode → confirmation that the move is not just alignment, but a structural turn.
✅ Notes
This script does not attempt to count Elliott Waves strictly (1-2-3-4-5, A-B-C). Instead it provides a framework for convergence and context, letting you apply your own EW interpretation on top.
Works best when combined with your own risk management rules (stops, partials, capital buffer).
Default EMAs (9/21/55/233/987) and pivot lookbacks (3/3) are optimized for intraday trading; adjust for your style (scalp, swing, position).
⚡ Bottom line:
The EW Convergence Suite is like having a multi-timeframe radar + price-level marker that alerts you when Elliott-style phases across several TFs line up. It cuts through noise and helps you focus on the moments of real structural confluence.
The EW Convergence Suite is a dual-component Elliott-Wave inspired tool designed to help traders spot multi-timeframe convergence points — the places where waves across different timeframes terminate together and trend changes often ignite.
It contains two parts:
🔹 HUD (Pane)
Lives in the lower pane, one horizontal row per timeframe (1m → 1M).
Colors represent phase classification:
Lime = Impulse Up (+2)
Red = Impulse Down (−2)
Teal = Corrective Up (+1)
Orange = Corrective Down (−1)
Gray = Neutral/Unclear
Rows shift slightly up/down depending on impulse vs. corrective, so you can see transitions as diagonal “jumps.”
HUD ticker (top-right) shows current convergence state:
Example: IMP▲[5m,15m,1h] = impulse up alignment on 3 TFs.
Example: ★ COR▼[30m,1h,4h,1d] = 4 TF corrective down alignment (special event).
🔹 Overlay Labels (on price chart)
Prints labels directly on the chart when convergence events meet your thresholds.
Shows which phases and which TFs are aligned at that moment.
Optional pivot confirmation:
Early mode → labels fire as soon as TFs align (onlyOnPivot=false).
Confirmed mode → labels fire only when convergence + a fresh pivot confirmation occur (onlyOnPivot=true + pivot lines on).
Can also draw multi-TF pivot lines to visually connect swing highs/lows across your chosen timeframes.
⚙️ Inputs & Customization
Timeframe Toggles → select which TFs to include in the convergence counts.
EMA Trend Stack (9/21/55/233/987 by default) → defines trend alignment for impulse vs. corrective classification.
Pivot left/right → sensitivity of swing highs/lows (2/2 = fast, 5/5 = smoother, 10/10+ = major swings).
MinN / SpecialN → thresholds for convergence events (regular vs. ★ special highlight).
Label Controls →
Only on pivot confirmations
Only on confirmed bars
Only when content changes
Minimum bar gap between labels
Wave Line Controls → toggle pivot-connecting lines per TF, with adjustable opacity and max lines stored.
🎯 How to Use
Scan the HUD for clusters of rows with the same color/phase. Flat plateaus across multiple TFs = strong alignment.
Wait for convergence counts (MinN or SpecialN) to be reached. HUD ticker will show IMP▲ or COR▼ with the TF list.
Watch the Overlay Labels on the price chart for where that convergence “hits” — optionally tied to fresh pivot confirmations.
Best practice:
Use lower TFs (1m/5m/15m) as entry triggers.
Use higher TFs (1h/4h/1D) as bias anchors.
Look for termination zones where both HUD alignment and Overlay labels agree.
🔑 Why it works
This indicator combines objective pivot detection with EMA-based trend structure to classify legs as impulsive or corrective. By watching multiple TFs simultaneously, it highlights the rare and powerful moments where waves across scales converge. These are often the cleanest points for entry, exit, or scaling.
Impulse convergence → continuation or breakout potential.
Corrective convergence → likely end of a pullback and resumption of higher-TF trend.
Pivot-gated mode → confirmation that the move is not just alignment, but a structural turn.
✅ Notes
This script does not attempt to count Elliott Waves strictly (1-2-3-4-5, A-B-C). Instead it provides a framework for convergence and context, letting you apply your own EW interpretation on top.
Works best when combined with your own risk management rules (stops, partials, capital buffer).
Default EMAs (9/21/55/233/987) and pivot lookbacks (3/3) are optimized for intraday trading; adjust for your style (scalp, swing, position).
⚡ Bottom line:
The EW Convergence Suite is like having a multi-timeframe radar + price-level marker that alerts you when Elliott-style phases across several TFs line up. It cuts through noise and helps you focus on the moments of real structural confluence.
受保護腳本
此腳本以閉源形式發佈。 不過,您可以自由使用,沒有任何限制 — 點擊此處了解更多。
免責聲明
這些資訊和出版物並非旨在提供,也不構成TradingView提供或認可的任何形式的財務、投資、交易或其他類型的建議或推薦。請閱讀使用條款以了解更多資訊。
受保護腳本
此腳本以閉源形式發佈。 不過,您可以自由使用,沒有任何限制 — 點擊此處了解更多。
免責聲明
這些資訊和出版物並非旨在提供,也不構成TradingView提供或認可的任何形式的財務、投資、交易或其他類型的建議或推薦。請閱讀使用條款以了解更多資訊。