OPEN-SOURCE SCRIPT
已更新 SLB | RSI 2W
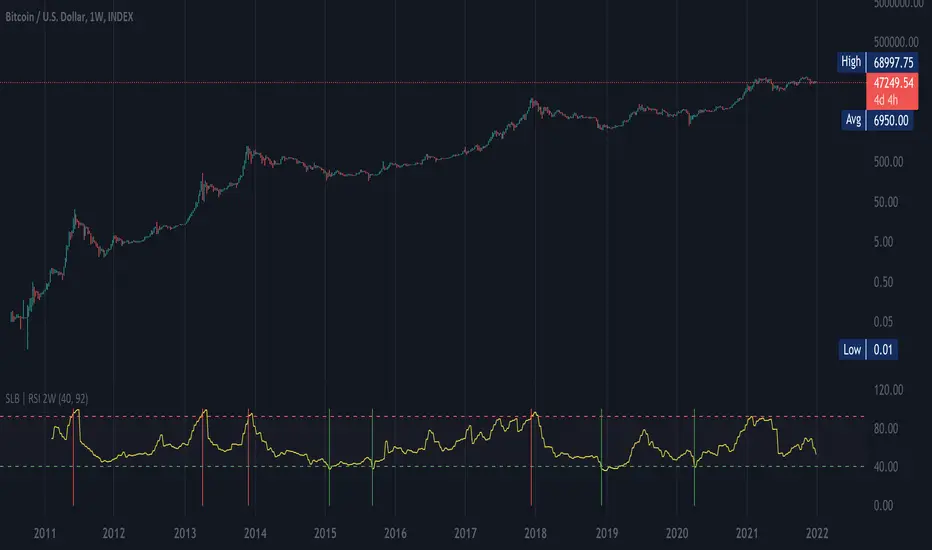
This script shows RSI ( Relative Strength Index ) over a 2 week period (RSI2W). The RSI2W is used by some traders to identify tops and valleys.
Taking historical BTC values as an example, the RSI 92+ (red lines) matches with the historical tops, and the RSI 40- (green lines) matches with the valleys, a good chance of bull markets' start.
Taking historical BTC values as an example, the RSI 92+ (red lines) matches with the historical tops, and the RSI 40- (green lines) matches with the valleys, a good chance of bull markets' start.
發行說明
moving default max rsi value from 92 to 91開源腳本
秉持TradingView一貫精神,這個腳本的創作者將其設為開源,以便交易者檢視並驗證其功能。向作者致敬!您可以免費使用此腳本,但請注意,重新發佈代碼需遵守我們的社群規範。
免責聲明
這些資訊和出版物並非旨在提供,也不構成TradingView提供或認可的任何形式的財務、投資、交易或其他類型的建議或推薦。請閱讀使用條款以了解更多資訊。
免責聲明
這些資訊和出版物並非旨在提供,也不構成TradingView提供或認可的任何形式的財務、投資、交易或其他類型的建議或推薦。請閱讀使用條款以了解更多資訊。