INVITE-ONLY SCRIPT
已更新 Multiple Popular Prices (x16)

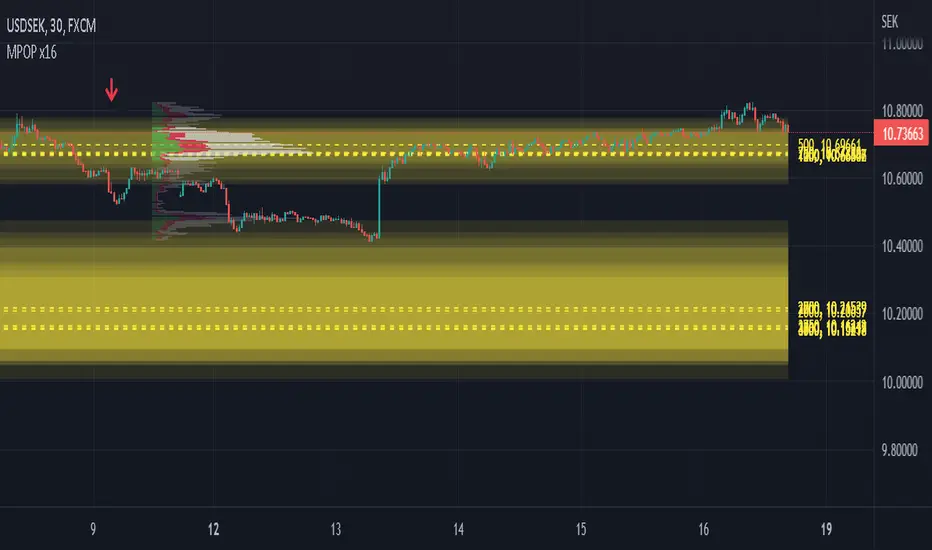
Up to 16 popular prices in 16 periods.
Lookback Period: Up to 5,000.
Support 01 volume profile (histogram) on price axis for the last period with up to 100 price ranges.
Histogram of 3 colors (up/down/sideways).
Markets: All.
Timeframes: All from 10s.
Usage: Price moves slowly in the popular price area (PPA) and moves fastly in the unpopular price area (UPA). When price breakouts a PPA, it could be forming an entry to a new PPA or an existing PPA. PPA of a period will move up if price continuously increases or is in an uptrend, and vice versa. It means that this indicator is led by price. Note that, when short-term PPA is higher/lower than long-term PPA, price did move and it is not a buy/sell entry.
Note: If calculation is timeout (“Loop takes too long to execute (> 500 ms)”), try to remove the indicator and reapply it, or try to increase the timeframe, or try to reduce the number of periods used to calculate popular prices.
發行說明
• Set default number of periods to 10.發行說明
• Set default number of periods to 8.發行說明
• Minor changes to reduce execution time.僅限邀請腳本
僅作者批准的使用者才能訪問此腳本。您需要申請並獲得使用許可,通常需在付款後才能取得。更多詳情,請依照作者以下的指示操作,或直接聯絡SupersafeTrader。
TradingView不建議在未完全信任作者並了解其運作方式的情況下購買或使用腳本。您也可以在我們的社群腳本中找到免費的開源替代方案。
作者的說明
• Subscribe as a patron on any tier (https://www.patreon.com/tuele99), then message me (TradingView private chat) your username and which indicator you want the access. I will confirm when the access is granted.
• 14-days free trial.
Public Indicators: tinyurl.com/26emm5e2
Disclaimer: tinyurl.com/4rtrwhfd
Disclaimer: tinyurl.com/4rtrwhfd
免責聲明
這些資訊和出版物並非旨在提供,也不構成TradingView提供或認可的任何形式的財務、投資、交易或其他類型的建議或推薦。請閱讀使用條款以了解更多資訊。
僅限邀請腳本
僅作者批准的使用者才能訪問此腳本。您需要申請並獲得使用許可,通常需在付款後才能取得。更多詳情,請依照作者以下的指示操作,或直接聯絡SupersafeTrader。
TradingView不建議在未完全信任作者並了解其運作方式的情況下購買或使用腳本。您也可以在我們的社群腳本中找到免費的開源替代方案。
作者的說明
• Subscribe as a patron on any tier (https://www.patreon.com/tuele99), then message me (TradingView private chat) your username and which indicator you want the access. I will confirm when the access is granted.
• 14-days free trial.
Public Indicators: tinyurl.com/26emm5e2
Disclaimer: tinyurl.com/4rtrwhfd
Disclaimer: tinyurl.com/4rtrwhfd
免責聲明
這些資訊和出版物並非旨在提供,也不構成TradingView提供或認可的任何形式的財務、投資、交易或其他類型的建議或推薦。請閱讀使用條款以了解更多資訊。