OPEN-SOURCE SCRIPT
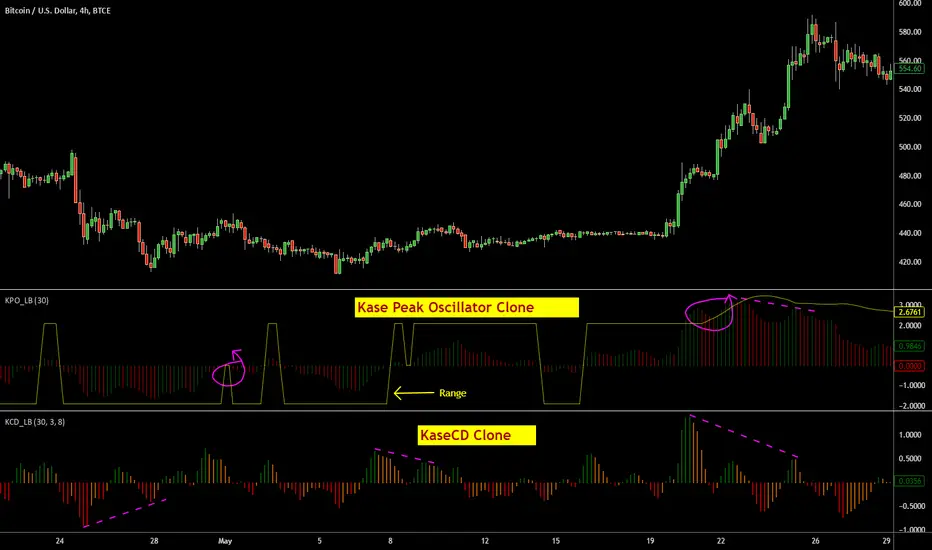
Indicators: KaseCD & Kase Peak Oscillator
I have included ports of 2 indicators from MT4 (not from the original commercial source). I couldn't cross check if these matched their commercial equivalents (you need to assume they don't!). If you own any of these in other platforms, appreciate if you could publish some comparison results here.
Kase Peak Oscillator [KPO] is the difference between two trend measurements, one for rising markets and the other for falling markets. KCD is the PeakOsc minus its own average. So, KPO takes the place of a traditional oscillator and the KCD takes place of the traditional MACD.
Ms.Kase claims KCD is far more accurate than MACD.
More info:
- kaseco.com/support/articles/The_Two_Faces_of_Momentum.pdf
- beathespread.com/file/download/15086
Let me know if you have experience with the original indicators and are willing to help improve these clones. Thanks.
開源腳本
本著TradingView的真正精神,此腳本的創建者將其開源,以便交易者可以查看和驗證其功能。向作者致敬!雖然您可以免費使用它,但請記住,重新發佈程式碼必須遵守我們的網站規則。
List of my free indicators: bit.ly/1LQaPK8
List of my indicators at Appstore: blog.tradingview.com/?p=970
List of my indicators at Appstore: blog.tradingview.com/?p=970
相關出版品
免責聲明
這些資訊和出版物並不意味著也不構成TradingView提供或認可的金融、投資、交易或其他類型的意見或建議。請在使用條款閱讀更多資訊。