PROTECTED SOURCE SCRIPT
BTC-CORRELATION
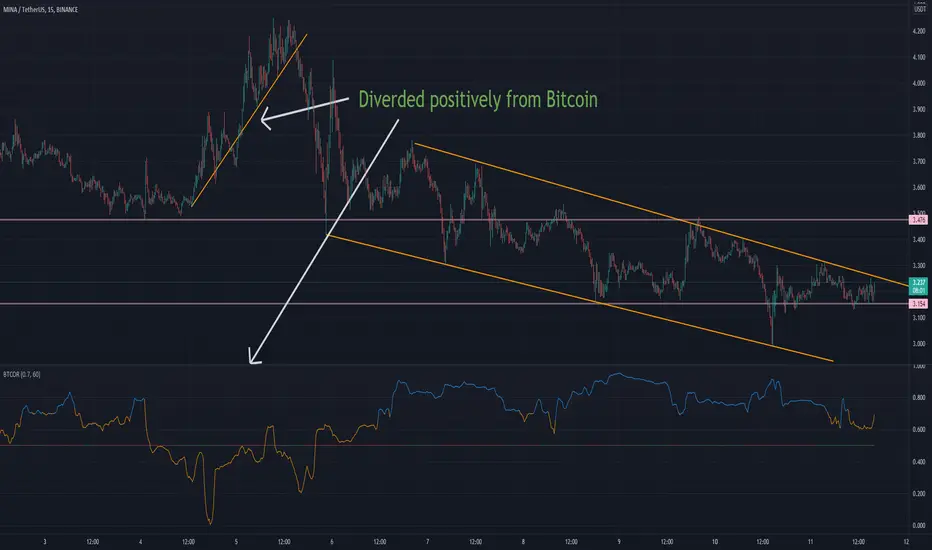
Shows Bitcoin correlation with the selected asset. Threshold can be adjusted between 0 and 1 for adjusting the level for which color changes to orange that is diverged while blue color is correlated. The fixed 0.5 value line changes color with red Bitcoin falling and green Bitcoin rising.
受保護腳本
此腳本以閉源形式發佈。 不過,您可以自由使用,沒有任何限制 — 點擊此處了解更多。
免責聲明
這些資訊和出版物並非旨在提供,也不構成TradingView提供或認可的任何形式的財務、投資、交易或其他類型的建議或推薦。請閱讀使用條款以了解更多資訊。
免責聲明
這些資訊和出版物並非旨在提供,也不構成TradingView提供或認可的任何形式的財務、投資、交易或其他類型的建議或推薦。請閱讀使用條款以了解更多資訊。