Knowing how to work with the datas in a company's financial statements is an essential skill for stock investors. The meaningful interpretation and analysis of balance sheets, income statements, and cash flow statements to discern a company's investment qualities is the basis for smart investment choices.
You can access to the financials tables of the companies as a summary with this indicator.
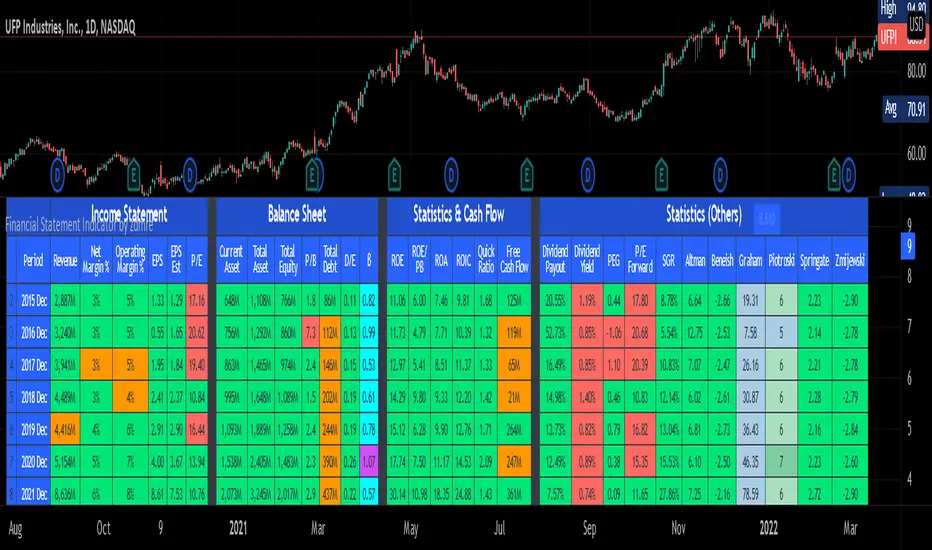
3 Tables;
Income Statement Table:
Revenue
Net Profit
EPS
EPS-D
P/E
Balance Sheet Table:
Current Asset
Total Asset
Total Equity
Book Value per Share
Total Debt
Debt/Equity
Statistics & Cash Flow Table:
Return On Equity
Return On Asset
Return On Invested Capital
Quick Ratio
Free Cash Flow
You can access to the financials tables of the companies as a summary with this indicator.
3 Tables;
Income Statement Table:
Revenue
Net Profit
EPS
EPS-D
P/E
Balance Sheet Table:
Current Asset
Total Asset
Total Equity
Book Value per Share
Total Debt
Debt/Equity
Statistics & Cash Flow Table:
Return On Equity
Return On Asset
Return On Invested Capital
Quick Ratio
Free Cash Flow
發行說明
- Added Tooltips
Added Filtering Data by Color
Fixed P/E Ratio
發行說明
- Added editable Text Color option.
發行說明
Fixed "FUND Error"Added EPS-D & P/E (Plot Data)
發行說明
Fixed Basic EPS
P/E Ratio
發行說明
- Added BETA Value and improvements made to the visuals.
發行說明
Removed
- BVPS (Book Value Per Share)
Added
*P/B (Price-to-Book Ratio)
*ROE/PB (Return on Equity / Price-to-Book Ratio)
*EPS Est (Earning Per Share Estimated)
發行說明
- Fixed Earnings Date problem.
發行說明
Added 4th Table and improvements made to the visuals.Statistics (Others):
Dividend Payout
Dividend Yield
PEG Ratio
PE Ratio (Forward 1y)
Sustainable Growth Rate (SGR)
Altman Z-SCORE
Beneish Model
Graham Number
Piotroski Score
Springate Score
Zmijewski Score
發行說明
New design - Added Headers
Added Tooltips for Titles
Table & Cell merging
發行說明
Added Net Margin / Operating Margin FilterHidden NaN values
發行說明
- Some additions have been made to the Plot data.
- The EPS data has been changed from Basic to Diluted.
- Minor UI improvements.
發行說明
Bug fixes.開源腳本
本著TradingView的真正精神,此腳本的創建者將其開源,以便交易者可以查看和驗證其功能。向作者致敬!雖然您可以免費使用它,但請記住,重新發佈程式碼必須遵守我們的網站規則。
免責聲明
這些資訊和出版物並不意味著也不構成TradingView提供或認可的金融、投資、交易或其他類型的意見或建議。請在使用條款閱讀更多資訊。
免責聲明
這些資訊和出版物並不意味著也不構成TradingView提供或認可的金融、投資、交易或其他類型的意見或建議。請在使用條款閱讀更多資訊。