INVITE-ONLY SCRIPT
已更新 RSI-2
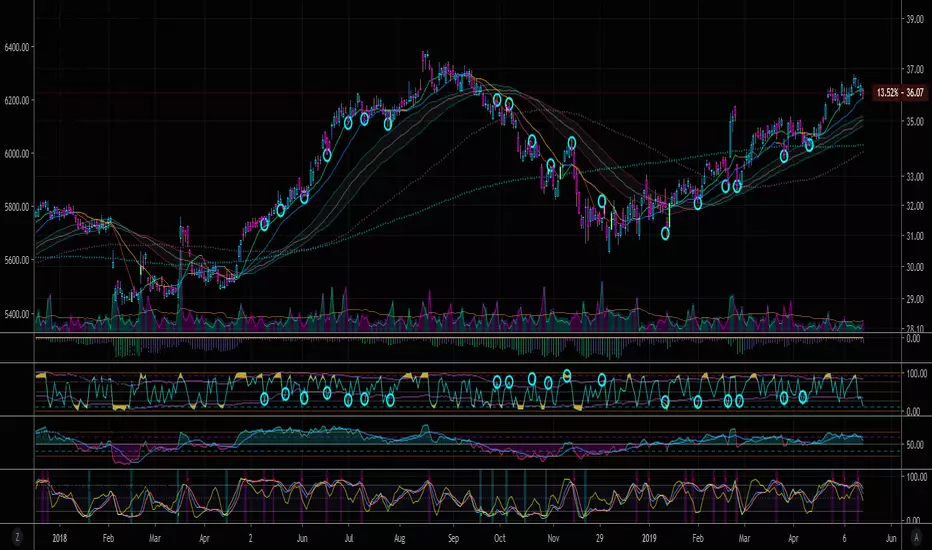
RSI-2 is an RSI indicator based on 2 periods.
It is used to locate pull back points within a major trend.
These points will generally offer the best risk/reward entry areas.
OB is >90
OS is <10
In an uptrend, long, when RSI-2 is OS
In a downtrend, short, when RSI-2 is OB
Start with 1D chart,
If RSI-2 gives too many signals (false signals) then use higher time frame, such as 3D
If RSi-2 gives not enough signals, then use a lower time frame, such as 3HR
For more information on RSI-2, read "Short term trading strategies that work"-by larry connors, chapter 9
發行說明
Updated version.Bollinger bands activated, to fix the prior issue where RSI-2 indicator was not sensitive enough on the current time frame to reach OS (<10) & OB (>90) areas.
With the bolinger bands, it effectively creates a corridor channel to use as OB & OS.
Bolinger band for RSI-2 uses 1 std dev over 31 periods.
traditional bolinger bands are based on: 2 std dev over 20 period ,
tradition TDI is based on: 1.618 std dev over 31 peroids
發行說明
update發行說明
update發行說明
update發行說明
update發行說明
update僅限邀請腳本
僅作者批准的使用者才能訪問此腳本。您需要申請並獲得使用許可,通常需在付款後才能取得。更多詳情,請依照作者以下的指示操作,或直接聯絡provalesco。
TradingView不建議在未完全信任作者並了解其運作方式的情況下購買或使用腳本。您也可以在我們的社群腳本中找到免費的開源替代方案。
作者的說明
免責聲明
這些資訊和出版物並非旨在提供,也不構成TradingView提供或認可的任何形式的財務、投資、交易或其他類型的建議或推薦。請閱讀使用條款以了解更多資訊。
僅限邀請腳本
僅作者批准的使用者才能訪問此腳本。您需要申請並獲得使用許可,通常需在付款後才能取得。更多詳情,請依照作者以下的指示操作,或直接聯絡provalesco。
TradingView不建議在未完全信任作者並了解其運作方式的情況下購買或使用腳本。您也可以在我們的社群腳本中找到免費的開源替代方案。
作者的說明
免責聲明
這些資訊和出版物並非旨在提供,也不構成TradingView提供或認可的任何形式的財務、投資、交易或其他類型的建議或推薦。請閱讀使用條款以了解更多資訊。