OPEN-SOURCE SCRIPT
RSI c/w MA, ADX and ATR data
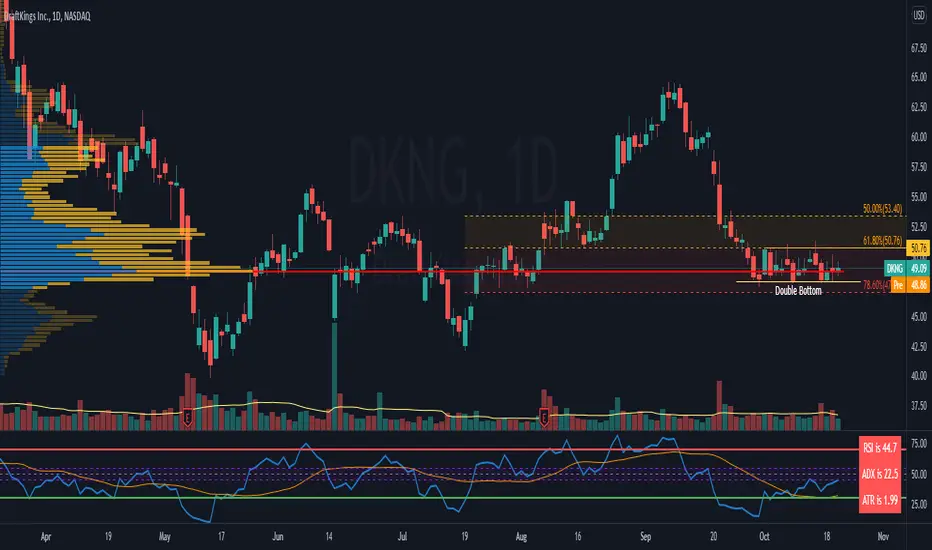
I have added 3 items to the RSI indicator which helps me to get more information at the same time.
1) ADX value - when ADX is above 25 we have a strong trend
2) ATR Value - helps me to calculate my daily targets and stop-loss levels at a glance.
3) A simple moving average - This shows me the trend of RSI. If the price breaks a trend line and at the same time RSI crosses above the MA, it shows me a breakout has happened. In longer timeframes, it can show you in advance if you should expect a reversal in the trend.
You can turn on or off the MA as well as the ADX line.
開源腳本
秉持TradingView一貫精神,這個腳本的創作者將其設為開源,以便交易者檢視並驗證其功能。向作者致敬!您可以免費使用此腳本,但請注意,重新發佈代碼需遵守我們的社群規範。
免責聲明
這些資訊和出版物並非旨在提供,也不構成TradingView提供或認可的任何形式的財務、投資、交易或其他類型的建議或推薦。請閱讀使用條款以了解更多資訊。
開源腳本
秉持TradingView一貫精神,這個腳本的創作者將其設為開源,以便交易者檢視並驗證其功能。向作者致敬!您可以免費使用此腳本,但請注意,重新發佈代碼需遵守我們的社群規範。
免責聲明
這些資訊和出版物並非旨在提供,也不構成TradingView提供或認可的任何形式的財務、投資、交易或其他類型的建議或推薦。請閱讀使用條款以了解更多資訊。