OPEN-SOURCE SCRIPT
Range + Breakout/Breakdown + Box [Sharad] v5
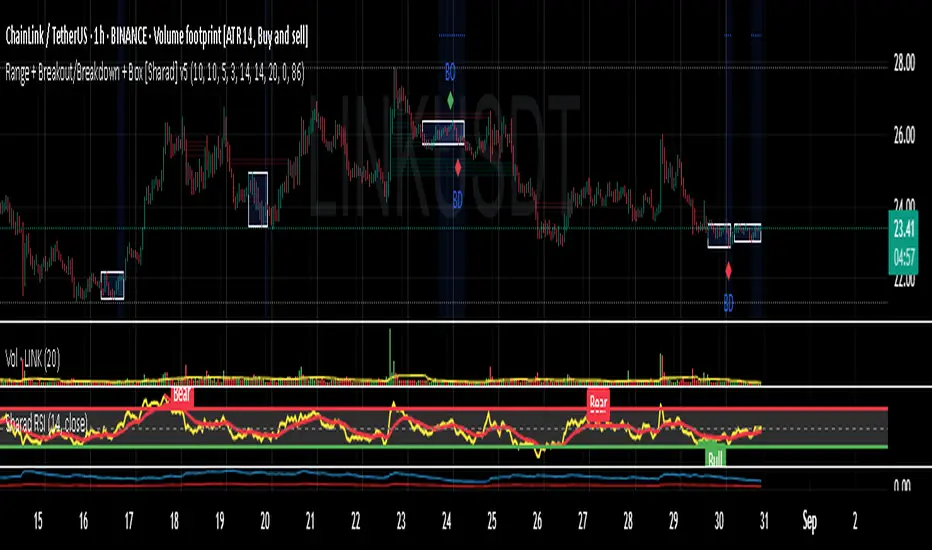
🔷 Range + Breakout/Breakdown + Box [Sharad]
This indicator is designed to detect consolidation ranges and highlight potential breakouts (up) or breakdowns (down) when price escapes those ranges.
It automatically draws a rectangle box over the detected range, making it easier to visualize sideways price action and potential coil patterns.
✨ Features
Detects range conditions based on:
Range width (as % of price and/or relative to ATR).
Consecutive bar count inside range.
Optional ADX filter for trend strength.
Highlights Breakout Up and Breakdown Down with on-chart markers.
Draws a box around the range that persists until the range ends.
Built-in TradingView alerts:
Range Detected
Breakout Up
Breakdown Down
Customizable inputs for sensitivity, buffer, and visualization.
⚠️ Warnings & Disclaimer
This tool is for educational and research purposes only.
It does NOT provide financial advice, trade recommendations, or guaranteed results.
Market conditions can invalidate signals; false breakouts are common.
Always backtest before using in live trading.
Use strict risk management (stop-loss, position sizing, risk–reward planning).
You are fully responsible for any trades taken using this indicator.
👉 Use at your own risk. Neither the author nor TradingView accepts liability for financial loss or damages.
開源腳本
本著TradingView的真正精神,此腳本的創建者將其開源,以便交易者可以查看和驗證其功能。向作者致敬!雖然您可以免費使用它,但請記住,重新發佈程式碼必須遵守我們的網站規則。
免責聲明
這些資訊和出版物並不意味著也不構成TradingView提供或認可的金融、投資、交易或其他類型的意見或建議。請在使用條款閱讀更多資訊。
免責聲明
這些資訊和出版物並不意味著也不構成TradingView提供或認可的金融、投資、交易或其他類型的意見或建議。請在使用條款閱讀更多資訊。