PROTECTED SOURCE SCRIPT
[DEM] Donchian Channels Bars
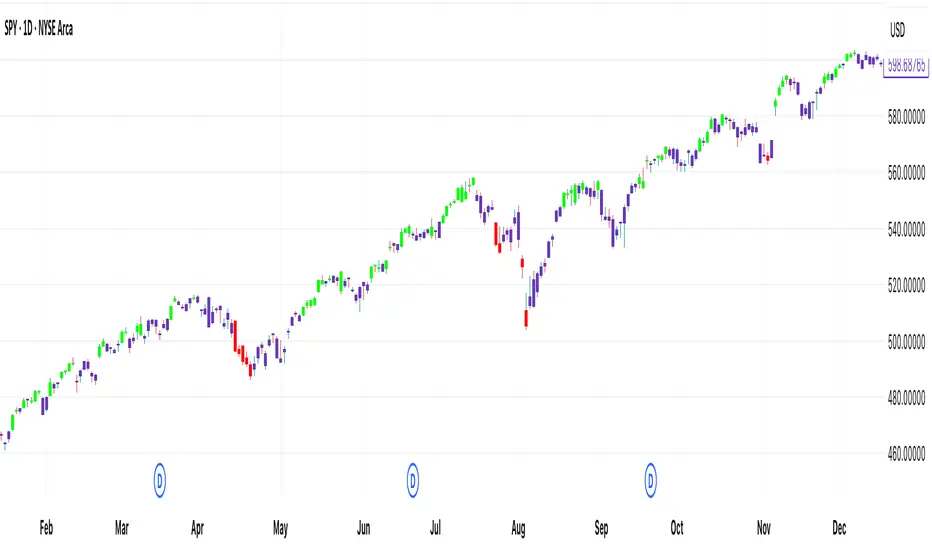
[DEM] Donchian Channels Bars is designed to color-code price bars based on their relationship to Donchian Channel breakouts by comparing short-term and long-term highest high and lowest low levels. The indicator uses two configurable lookback periods (default 1 and 20 bars) and colors bars green when the shorter-period highest high equals the longer-period highest high (indicating an upward breakout or new high), red when the shorter-period lowest low equals the longer-period lowest low (indicating a downward breakout or new low), and purple when neither condition is met. This visual system helps traders quickly identify when price is making significant moves beyond established ranges, with green bars highlighting potential bullish breakouts above recent resistance and red bars highlighting potential bearish breakouts below recent support levels.
受保護腳本
此腳本以閉源形式發佈。 不過,您可以自由使用,沒有任何限制 — 點擊此處了解更多。
免責聲明
這些資訊和出版物並非旨在提供,也不構成TradingView提供或認可的任何形式的財務、投資、交易或其他類型的建議或推薦。請閱讀使用條款以了解更多資訊。
受保護腳本
此腳本以閉源形式發佈。 不過,您可以自由使用,沒有任何限制 — 點擊此處了解更多。
免責聲明
這些資訊和出版物並非旨在提供,也不構成TradingView提供或認可的任何形式的財務、投資、交易或其他類型的建議或推薦。請閱讀使用條款以了解更多資訊。