PROTECTED SOURCE SCRIPT
已更新 Market Profile
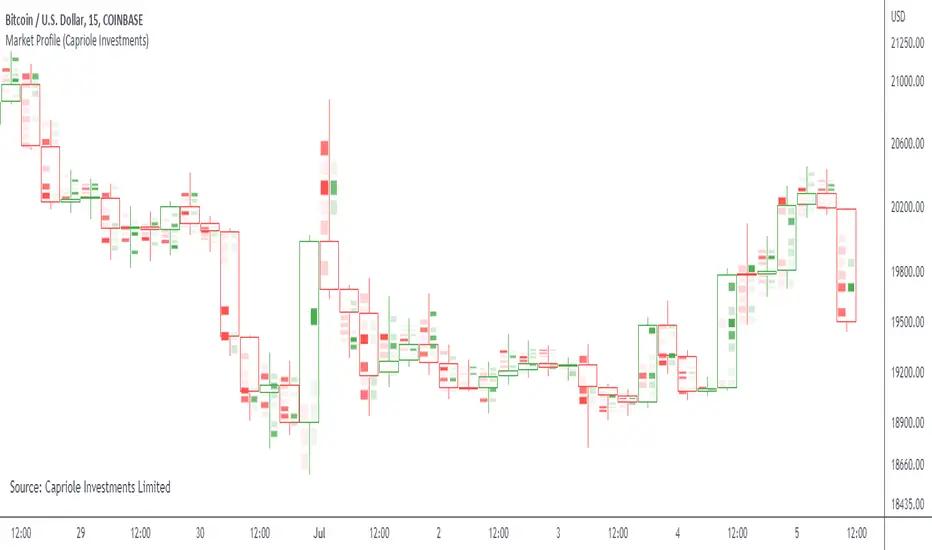
Simple "Market Profile" script to help visualize where high volume nodes are occurring on higher-time frame candles.
Historical lookback is visually limited based on the number of candles TradingView provides on the chosen timeframe.
The script calculates the buy/sell pressure on the timeframe chosen, and aggregates volume up to the higher timeframe of choice (default: 4hr).
The volume for each candle is then normalized to assess how many standard deviations away from the mean it is. The color gradient on the chart is stronger for readings with more extreme z-scores.
Readings which are less than 2-standard deviations from the mean are not colored (white) - making it easier to visualize where the extremities of volume occur only.
Recommend using on default settings, on the 5-min of 15-min chart. Then hide the normal price data by clicking the "eye" symbol.
If you want to visualize historic periods, you can change the lookback settings.
發行說明
Sourcing update受保護腳本
此腳本以閉源形式發佈。 不過,您可以自由使用,沒有任何限制 — 點擊此處了解更多。
免責聲明
這些資訊和出版物並非旨在提供,也不構成TradingView提供或認可的任何形式的財務、投資、交易或其他類型的建議或推薦。請閱讀使用條款以了解更多資訊。
受保護腳本
此腳本以閉源形式發佈。 不過,您可以自由使用,沒有任何限制 — 點擊此處了解更多。
免責聲明
這些資訊和出版物並非旨在提供,也不構成TradingView提供或認可的任何形式的財務、投資、交易或其他類型的建議或推薦。請閱讀使用條款以了解更多資訊。