PROTECTED SOURCE SCRIPT
已更新 ICT New Day Opening Gap
New Day Opening Gap
The New Day Opening Gap (NDOG) is defined by The Inner Circle Trader (ICT) as the separation in time/price that is caused by the 1-hour break that occurs each day in the futures market. The opening price of the gap is the very first tick that occurs at the 6:00pm [UTC-4] restart; then we look at the 5:00pm closing price of the previous session. This New Day Opening Gap forms every day from Monday to Friday, but it does not include the gap between Friday's close and Sunday's open (because that is instead referred to as a New Week Opening Gap).

This is an example of a New Day Opening Gap (NDOG) for Wednesday, May 22, 2024 in ES1!
ES1!
How To Use NDOG
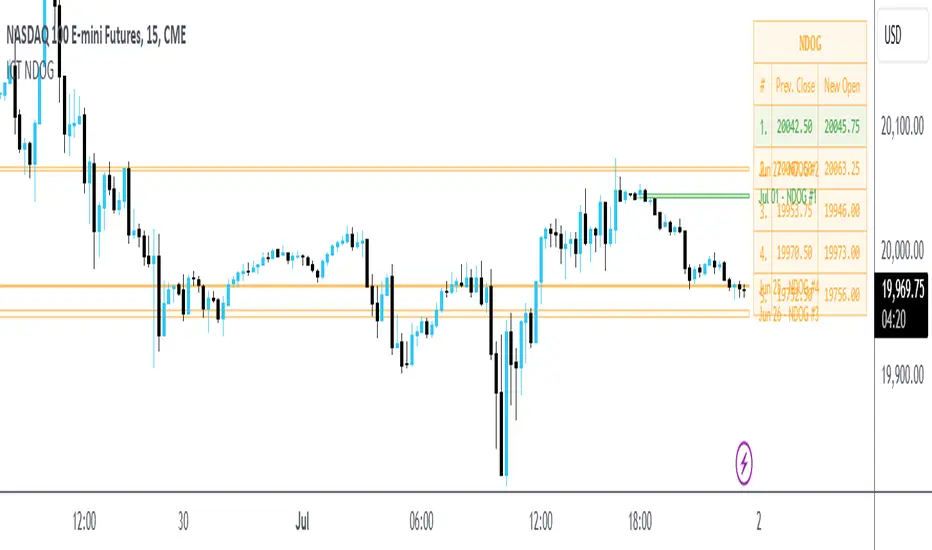
When an NDOG forms, it can be extended into future price action. One way to use these gaps is to look for it to be filled in by price action. Another usage for these gaps is to look for support & resistance to come in at the high and low of these NDOGs (as well as the midpoint).
Disclaimer
This indicator is mainly intended to work for Futures markets, and specifically the following Index Futures markets: E-mini S&P 500 Futures, E-mini NASDAQ-100 Futures, E-mini DOW Futures.
Given that, the indicator still supports various other markets/assets out-of-the-box, such as other types of Futures Markets, Forex markets, Stocks, Options, and more. The main difference will be that other markets may have NDOGs forming at different times, rather than the 5pm-6pm gap that occurs in the Index Futures.
Indicator Features
This indicator is 100% custom-built, not using code from any other existing NDOG plotting indicators. The purpose of this indicator was to overcome many shortcomings from other existing indicators. Therefore, this indicator has many UNIQUE features, such as:
Error Messages
There are some conditions which can cause the script to fail and display an error message (by clicking the red exclamation mark next to the indicator.)
Error messages:

This is an example of what a script error would look like.
Indicator Settings
Most settings are self-explanatory or have a tooltip with information on what the setting does, so this section will only briefly cover the available settings.


These settings are used to customize the visual style of the most recent NDOG (also known as the "Current" NDOG). Note: the exact same set of settings are available for the Previous NDOGs. The text next to each NDOG can be optionally hidden to clean the chart a little.

These are settings to customize the appearance of the Price Table on the right, including the ability to hide it completely.

One of 7 available overlap handling options can be used to filter which NDOGs are plotted on the chart. By default, the "None" option will be selected, meaning that all valid NDOGs are plotted on the chart.


This option can be toggled to allow displaying NDOGs for markets that may not have an actual gap between days, such as Forex markets, or BTC/USD (which is traded 24/7). Note: this option must be used at your own discretion because the opening/closing times for the NDOGs are not guaranteed to be accurate.
Tooltips
The indicator provides additional details about an NDOG when you hover over a row in the Price Table.

Note: the same information can be found by hovering over the Text Label that is to the right of each NDOG.
Overlap Handling
The tooltip next to "Select a Strategy" in the options will provide details on each overlap handling strategy. Additionally, when a strategy is selected, a new row in the Price Table will appear; hovering over that will show details about the currently selected strategy, as well as any suggestions in case the inputs were invalid. When a strategy hides an NDOG, the number in the Price Table will be replaced with an "Eye" icon, indicating that it is not currently plotted on the chart.
Available strategies are:

This is an example that chooses the Overlap Handling Strategy Option 6. Note that in this example, the tooltip in the price table shows a warning that the Input Number should be increased to plot some NDOGs on the chart.
Tips

The New Day Opening Gap (NDOG) is defined by The Inner Circle Trader (ICT) as the separation in time/price that is caused by the 1-hour break that occurs each day in the futures market. The opening price of the gap is the very first tick that occurs at the 6:00pm [UTC-4] restart; then we look at the 5:00pm closing price of the previous session. This New Day Opening Gap forms every day from Monday to Friday, but it does not include the gap between Friday's close and Sunday's open (because that is instead referred to as a New Week Opening Gap).
This is an example of a New Day Opening Gap (NDOG) for Wednesday, May 22, 2024 in
How To Use NDOG
When an NDOG forms, it can be extended into future price action. One way to use these gaps is to look for it to be filled in by price action. Another usage for these gaps is to look for support & resistance to come in at the high and low of these NDOGs (as well as the midpoint).
Disclaimer
This indicator is mainly intended to work for Futures markets, and specifically the following Index Futures markets: E-mini S&P 500 Futures, E-mini NASDAQ-100 Futures, E-mini DOW Futures.
Given that, the indicator still supports various other markets/assets out-of-the-box, such as other types of Futures Markets, Forex markets, Stocks, Options, and more. The main difference will be that other markets may have NDOGs forming at different times, rather than the 5pm-6pm gap that occurs in the Index Futures.
Indicator Features
This indicator is 100% custom-built, not using code from any other existing NDOG plotting indicators. The purpose of this indicator was to overcome many shortcomings from other existing indicators. Therefore, this indicator has many UNIQUE features, such as:
- Ability to maintain accuracy of the closing/opening prices even when changing chart settings (e.g., toggling ETH/RTH sessions, toggling BACK-ADJUSTMENT on futures contracts, toggling SETTLEMENT prices, etc.).
- Draw up to 25 previous NDOGs, even on ultra-low timeframes like the 1-minute or 1-second chart.
- Automatically or manually choose which NDOGs to hide/show on the chart.
- Highly customizable, including a different color scheme to easily distinguish between the Current and Previous NDOGs.
- Modified price values to correctly display prices that use a format like 109'32 (e.g., Bond Futures or Wheat Futures).
- Helpful tooltips to provide more detailed information about the NDOGs or about the current Input Settings.
Error Messages
There are some conditions which can cause the script to fail and display an error message (by clicking the red exclamation mark next to the indicator.)
Error messages:
- Use a Standard Chart Type: this will occur when using a non-standard chart such as Heikin Ashi, Renko, Point & Figure, etc.
- Use a Daily or Lower Timeframe: this error will appear when using a higher timeframe chart like weekly or monthly, because it can clutter the chart since NDOGs can form every day.
- NDOG was not detected: this means that no NDOG was found, for example if the chart did not have enough bars/candles (e.g., some Options markets).
- Exceeded the maximum lookback for Bar Replay mode: when using bar replay mode; this can depend on the amount of historical bars available in different account subscription types.
- Unable to Activate Bar Replay mode: if the indicator could not be used in Bar Replay mode.
- Restart Bar Replay: if the indicator works in Bar Replay but it detected an error that would cause NDOGs to be plotted incorrectly.
- NDOG was not detected. Toggle "Error Handling" Option at your own discretion: this is more of a warning message that will appear when the indicator does not detect any actual gap between the days (e.g., Forex markets where it is continuously traded through each day, without any gap forming in between). But the warning can be dismissed by toggling the checkbox at the bottom of the Indicator's Input Settings.
This is an example of what a script error would look like.
Indicator Settings
Most settings are self-explanatory or have a tooltip with information on what the setting does, so this section will only briefly cover the available settings.
- The "Extend to End of Week" option is enabled by default, which will extend each NDOG only up to the end of the week that it belongs to. This option can be toggled OFF to automatically extend all NDOGs to the right-most candle on the chart.
- Previous NDOGs: Between 1 and 25 previous NDOGs can be displayed. The checkbox can be toggled to quickly hide all previous NDOGs (but the same effect would be reached by setting the value to 0).
- Hide Current NDOG: the current NDOG (colored in Green in the example above), can be optionally hidden from being plotted.
These settings are used to customize the visual style of the most recent NDOG (also known as the "Current" NDOG). Note: the exact same set of settings are available for the Previous NDOGs. The text next to each NDOG can be optionally hidden to clean the chart a little.
These are settings to customize the appearance of the Price Table on the right, including the ability to hide it completely.
One of 7 available overlap handling options can be used to filter which NDOGs are plotted on the chart. By default, the "None" option will be selected, meaning that all valid NDOGs are plotted on the chart.
- Date Format: select the format of the date that is shown next to each NDOG.
- Timezone: choose the timezone for the NDOG closing/opening date-times that are displayed (only in tooltips when you hover over an NDOG label).
- NDOG Label: choose the details to display next to each NDOG (e.g., date, or NDOG number, or both).
- Price Format: only two options: Auto/Decimal. "Auto" uses custom processing to allow displaying values such as 109'32 for Bond futures.
This option can be toggled to allow displaying NDOGs for markets that may not have an actual gap between days, such as Forex markets, or BTC/USD (which is traded 24/7). Note: this option must be used at your own discretion because the opening/closing times for the NDOGs are not guaranteed to be accurate.
Tooltips
The indicator provides additional details about an NDOG when you hover over a row in the Price Table.
Note: the same information can be found by hovering over the Text Label that is to the right of each NDOG.
Overlap Handling
The tooltip next to "Select a Strategy" in the options will provide details on each overlap handling strategy. Additionally, when a strategy is selected, a new row in the Price Table will appear; hovering over that will show details about the currently selected strategy, as well as any suggestions in case the inputs were invalid. When a strategy hides an NDOG, the number in the Price Table will be replaced with an "Eye" icon, indicating that it is not currently plotted on the chart.
Available strategies are:
- Option 1 (Gradients): select the percentage opacity to shade NDOGs in. The more recent NDOGs will be closer to the maximum opacity defined, while the older NDOGs will appear more transparent, closer to the minimum opacity defined. Note: only affects previous NDOGs, not the current NDOG.
- Option 2 (Week Extension): select the number of weeks to extend each NDOG up to. Note: this will override the "Extend to End of Week" setting, regardless whether it is toggled ON or OFF.
- Option 3 (Nested Gaps): hides nested gaps, i.e., NDOGs that are enclosed within another NDOG. Note: this option is only available when the "Extend to End of Week" setting is disabled.
- Option 4 (Intersecting Gaps): hides intersecting/overlapping gaps, i.e., NDOGs that overlap one another (this may also include, but is not limited to, nested gaps). The drop-down next to this option allows choosing the priority of which NDOGs to hide first. Note: this option is only available when the "Extend to End of Week" setting is disabled.
- Option 5 (Gap Width): the chart will only show NDOGs that have a width between the defined parameters. This can be useful to filter out NDOGs that are deemed "insignificant". For example, the Inner Circle Trader will generally filter out of his analysis any NDOGs that are less than a point (4 ticks) for Index futures.
- Option 6 (Close Proximity): the chart will only show the NDOGs that are within a certain range from the market price. This can be useful when plotting multiple NDOGs while using auto-scaling on the chart. By only showing nearby NDOGs, it will prevent the auto-scaling from having to compress the candles to fit the far-away NDOGs onto the screen.
- Option 7 (CSV): this option is used if none of the others suit you well; it allows specifically choosing which NDOGs to hide or show on the chart.
This is an example that chooses the Overlap Handling Strategy Option 6. Note that in this example, the tooltip in the price table shows a warning that the Input Number should be increased to plot some NDOGs on the chart.
Tips
- Chart settings can be toggled to "Scale price chart only" to prevent the auto-scaling of TradingView from compressing the chart if there are NDOGs that are far away from the current market action.
- If you change a lot of indicator settings such as NDOG color schemes, you can save the settings as the Default to prevent your settings from resetting the next time you use the indicator.
發行說明
- New setting: "Show Zero-Width Gaps" to allow plotting the 6:00pm opening price if there is no gap since it can still be a useful support/resistance level.
- New setting: "Bar Offset" to allow shifting NDOGs to the right.
- New setting: "Minimum Gap Width to Plot C.E." which will hide C.E. levels if the NDOG total range is less than a certain size (only affects Previous NDOGs).
- New setting: "Minimum Gap Width to Plot Quadrants" which will hide upper quadrant and lower quadrant levels if the NDOG total range is less than a certain size (only affects Previous NDOGs).
- Line Style & Width can now be adjusted for all NDOG levels (high/low, C.E., upper/lower quadrants).
- Additional date format options, including full month names.
- Removed setting: "
Price Format" since no issues were reported with the displayed price levels. - Added ability to draw NDOGs using lines instead of boxes (see example below).
- Updated NDOG labels to show the date that the gaps are used on rather than the actual date it formed on (see example below).
Example with settings changed to plot NDOGs with Lines instead of Boxes.
Example of updated NDOG label which shows the date for the Daily candle it belongs to (Friday, September 06). Prior to this update, the NDOG would have been labeled as "Thursday, September 05".
發行說明
- Fixed issue where script fails when using Bar Replay on a Monday.
- Changed default value for "Extend to End of Week" setting to false.
- New setting: "New Day Opening Gap Type" to allow toggling between the two types of NDOGs: one that starts from the previous day's Electronic Trading Hours (ETH) Close or the previous day's Regular Trading Hours (RTH) Close. The tooltip next to the new setting will show more details including the available options.
Screenshot showing the new setting + the updated NDOG tooltips.
- When hovering over the NDOG text labels, it will also show details about the other type of NDOG (if it exists) for quick comparison.
- NDOGs that are plotted using the previous day's RTH Close will be labeled as "NDOG RTH" instead of just "NDOG".
- There are only 5 available options for choosing which NDOG types to show. If additional customization is needed, you can overlay 2 NDOG indicators where one uses "ETH Only" and the other uses "RTH Only", then use Overlap Handling Strategy Option 7 to hide/show specific NDOGs.
發行說明
Moved to Pine Script v6Additional minor changes:
- Text Labels: using the new built-in 𝗯𝗼𝗹𝗱 & 𝘪𝘵𝘢𝘭𝘪𝘤 text formatting. Also added the 𝕕𝕠𝕦𝕓𝕝𝕖-𝕤𝕥𝕣𝕦𝕔𝕜 font option.
- Price Table: added the 𝘪𝘵𝘢𝘭𝘪𝘤 and 𝕕𝕠𝕦𝕓𝕝𝕖-𝕤𝕥𝕣𝕦𝕔𝕜 font options.
- Text Size: larger variety of text sizes to choose from.
- Date Format: additional date format options including DD/MM format.
- Timezone: larger variety of timezones to choose from.
- Using 12-hour format to display NWOG start & end times (within the pop-up tooltips) instead of the 24-hour format.
受保護腳本
此腳本以閉源形式發佈。 不過,您可以自由使用,沒有任何限制 — 點擊此處了解更多。
免責聲明
這些資訊和出版物並非旨在提供,也不構成TradingView提供或認可的任何形式的財務、投資、交易或其他類型的建議或推薦。請閱讀使用條款以了解更多資訊。
受保護腳本
此腳本以閉源形式發佈。 不過,您可以自由使用,沒有任何限制 — 點擊此處了解更多。
免責聲明
這些資訊和出版物並非旨在提供,也不構成TradingView提供或認可的任何形式的財務、投資、交易或其他類型的建議或推薦。請閱讀使用條款以了解更多資訊。