INVITE-ONLY SCRIPT
已更新 Scalper MAN

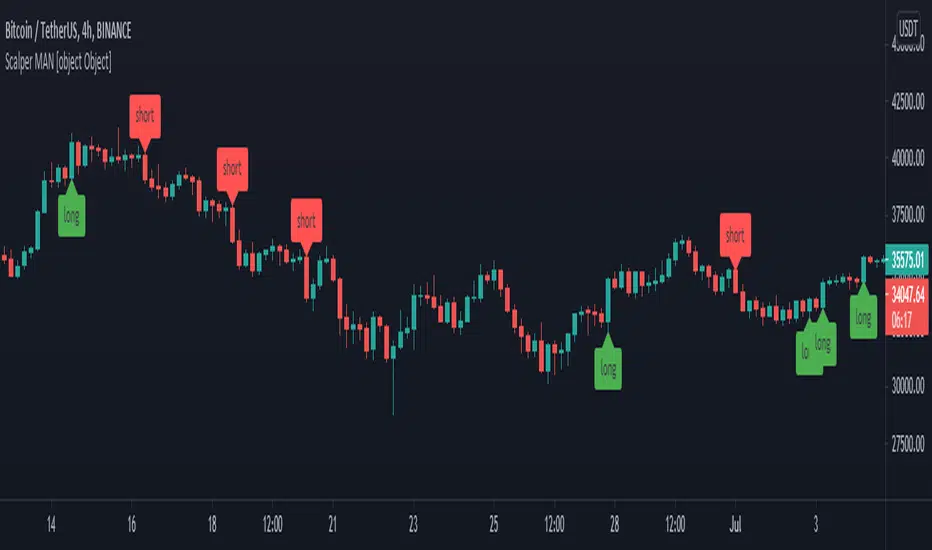
I explain very simply that the purpose of making this indicator is simple, and we have tried to remove all the extra lines that cause trader focus on chart better, so with a long, short display after analysis, it is enough for your trade.
This style allows you to integrate with other complementary strategies in addition because we make chart too simple you can combine this indicator with your strategy.
The important point is that this indicator is only visible at 4-hour intervals, so you can use lower timeframes to optimize entry and exit points.

Also, according to the image above, it’s better that when signals are near support and resistant areas do not trade.
Another point is that for better optimization, when market is in up or down trend, signals can be considered more reliable.
Finally, consider (R / R) for better results.
As a recommendation, you should always consider non-systematic risks, for example for charts such as gold , as well as news and economic events.
In fact, this indicator is more concerned with the crypto currency , although it has a lot of power for other charts
This indicator is designed for two-way markets
First of all we tried to recognize the points that market enter a trend, actually to get rid of sideways.
For this issue we have used the combination of MovingAverages from different periods.
One of our reasons that we work on just one time frame is that periods of MovingAverages are fixed, and if it was to change the time frame, structure of periods should be changed.
After possible diagnosis about that market is entered up or down trend it’s time to recognize that this trend is continuous or not.
For this issue we used points and possible patterns that candles continue the trend, in addition we tried to get rid of noises.
<< RUN AND WAIT >>
This style allows you to integrate with other complementary strategies in addition because we make chart too simple you can combine this indicator with your strategy.
The important point is that this indicator is only visible at 4-hour intervals, so you can use lower timeframes to optimize entry and exit points.
Also, according to the image above, it’s better that when signals are near support and resistant areas do not trade.
Another point is that for better optimization, when market is in up or down trend, signals can be considered more reliable.
Finally, consider (R / R) for better results.
As a recommendation, you should always consider non-systematic risks, for example for charts such as gold , as well as news and economic events.
In fact, this indicator is more concerned with the crypto currency , although it has a lot of power for other charts
This indicator is designed for two-way markets
First of all we tried to recognize the points that market enter a trend, actually to get rid of sideways.
For this issue we have used the combination of MovingAverages from different periods.
One of our reasons that we work on just one time frame is that periods of MovingAverages are fixed, and if it was to change the time frame, structure of periods should be changed.
After possible diagnosis about that market is entered up or down trend it’s time to recognize that this trend is continuous or not.
For this issue we used points and possible patterns that candles continue the trend, in addition we tried to get rid of noises.
<< RUN AND WAIT >>
發行說明
- Fixed a bug in displaying short type label僅限邀請腳本
只有經作者批准的使用者才能訪問此腳本。您需要申請並獲得使用權限。該權限通常在付款後授予。如欲了解更多詳情,請依照以下作者的說明操作,或直接聯絡yer_savasci。
除非您完全信任其作者並了解腳本的工作原理,否則TradingView不建議您付費或使用腳本。您也可以在我們的社群腳本中找到免費的開源替代方案。
作者的說明
For more information message us
免責聲明
這些資訊和出版物並不意味著也不構成TradingView提供或認可的金融、投資、交易或其他類型的意見或建議。請在使用條款閱讀更多資訊。
僅限邀請腳本
只有經作者批准的使用者才能訪問此腳本。您需要申請並獲得使用權限。該權限通常在付款後授予。如欲了解更多詳情,請依照以下作者的說明操作,或直接聯絡yer_savasci。
除非您完全信任其作者並了解腳本的工作原理,否則TradingView不建議您付費或使用腳本。您也可以在我們的社群腳本中找到免費的開源替代方案。
作者的說明
For more information message us
免責聲明
這些資訊和出版物並不意味著也不構成TradingView提供或認可的金融、投資、交易或其他類型的意見或建議。請在使用條款閱讀更多資訊。