OPEN-SOURCE SCRIPT
Easy to Use 50/100/200 Day Moving Average Strategy
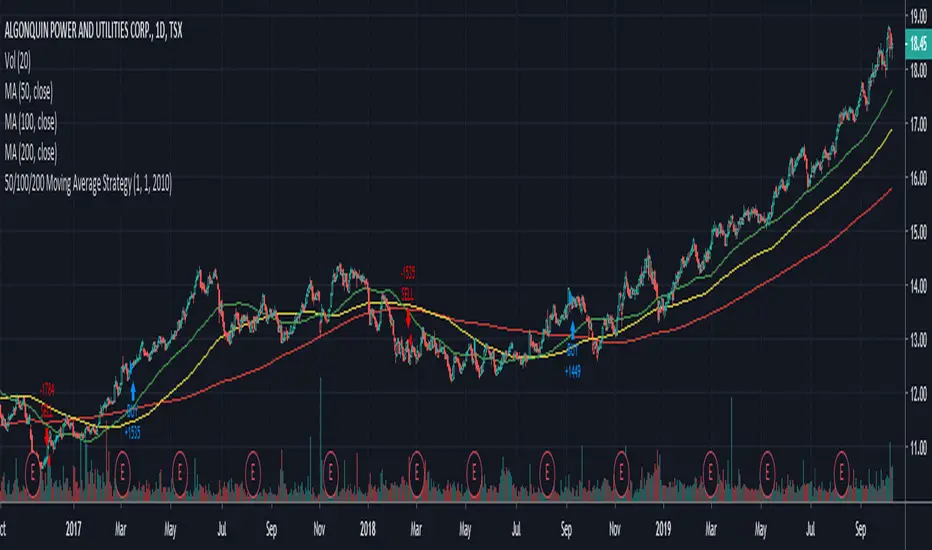
Whenever you see someone publish a chart or idea, what's the one thing you almost always see? Moving Averages!
Many investors focus on these indictors solely as entry and exit points, so here's an easy to manipulate strategy to backtest and see if this is feasible on your security.
CODE VARIABLES
LINE 2 - Here you can change your currency and amount you want to invest on each entry.
LINE 8/9/10 - Here we establish the 50 (Fast), 100 (Medium) and 200 (Slow) day variables. These can be adjusted to your choosing.
LINE 13/14/15 - Here we establish what date we want to start backtesting from. Simple change the defval on each line to change the date (In the code below we start on Jan 1st, 2010).
LINE 20/23 - Here, within the crossover and crossunder functions, we set which MA's must cross to enter and exit a trade. Below we have the 50 day moving above and under the 200 day. Simple change the variables to FastMA, MediumMA and SlowMA to your choosing.
NOTE: As a beginner you may not want to short stock, therefore LINE 5 was added to only allow long positions.
Hope this helps, from one beginner to another.
Cheers!
開源腳本
本著TradingView的真正精神,此腳本的創建者將其開源,以便交易者可以查看和驗證其功能。向作者致敬!雖然您可以免費使用它,但請記住,重新發佈程式碼必須遵守我們的網站規則。
免責聲明
這些資訊和出版物並不意味著也不構成TradingView提供或認可的金融、投資、交易或其他類型的意見或建議。請在使用條款閱讀更多資訊。
開源腳本
本著TradingView的真正精神,此腳本的創建者將其開源,以便交易者可以查看和驗證其功能。向作者致敬!雖然您可以免費使用它,但請記住,重新發佈程式碼必須遵守我們的網站規則。
免責聲明
這些資訊和出版物並不意味著也不構成TradingView提供或認可的金融、投資、交易或其他類型的意見或建議。請在使用條款閱讀更多資訊。