PINE LIBRARY
已更新 rzigzag
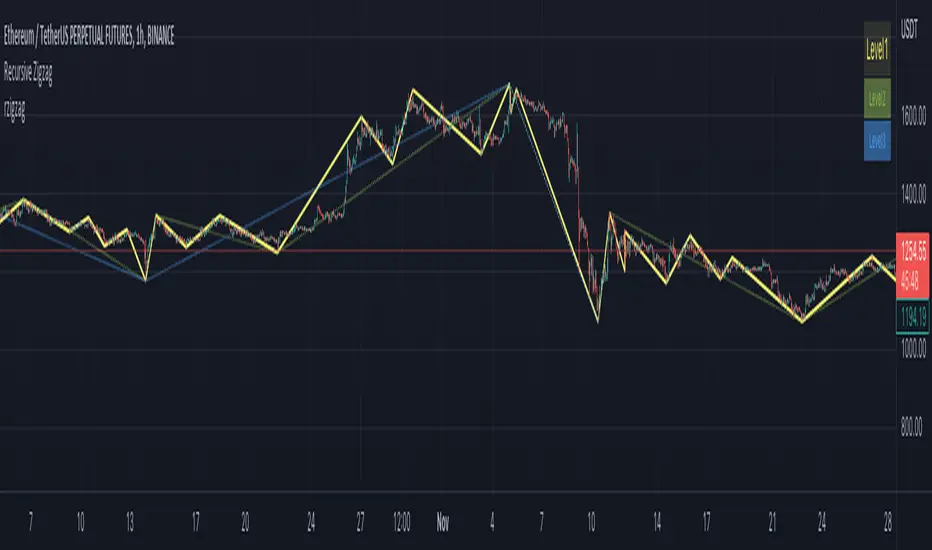
Library "rzigzag"
Recursive Zigzag Using Matrix allows to create zigzags recursively on multiple levels. After bit of consideration, decided to make this public.
zigzag(length, ohlc, numberOfPivots, offset)
calculates plain zigzag based on input
Parameters:
length: Zigzag Length
ohlc: Array containing ohlc values. Can also contain custom series
numberOfPivots: Number of max pivots to be returned
offset: Offset from current bar. Can be used for calculations based on confirmed bars
Returns: [matrix<float> zigzagmatrix, bool newPivot, bool doublePivot]
nextlevel(zigzagmatrix, numberOfPivots)
calculates next level zigzag based on present zigzag coordinates
Parameters:
zigzagmatrix: Matrix containing zigzag pivots, bars, bar time, direction and level
numberOfPivots: Number of max pivots to be returned
Returns: matrix<float> zigzagmatrix
draw(zigzagmatrix, newPivot, doublePivot, lineColor, lineWidth, lineStyle, showLabel, xloc)
draws zigzag based on the zigzagmatrix input
Parameters:
zigzagmatrix: Matrix containing zigzag pivots, bars, bar time, direction and level
newPivot: Flag indicating there is update in the pivots
doublePivot: Flag containing there is double pivot update on same bar
lineColor: Zigzag line color
lineWidth: Zigzag line width
lineStyle: Zigzag line style
showLabel: Flag to indicate display pivot labels
xloc: xloc preference for drawing lines/labels
Returns: [array<line> zigzaglines, array<label> zigzaglabels]
draw(length, ohlc, numberOfPivots, offset, lineColor, lineWidth, lineStyle, showLabel, xloc)
calculates and draws zigzag based on zigzag length and source input
Parameters:
length: Zigzag Length
ohlc: Array containing ohlc values. Can also contain custom series
numberOfPivots: Number of max pivots to be returned
offset: Offset from current bar. Can be used for calculations based on confirmed bars
lineColor: Zigzag line color
lineWidth: Zigzag line width
lineStyle: Zigzag line style
showLabel: Flag to indicate display pivot labels
xloc: xloc preference for drawing lines/labels
Returns: [matrix<float> zigzagmatrix, array<line> zigzaglines, array<label> zigzaglabels, bool newPivot, bool doublePivot]
drawfresh(zigzagmatrix, zigzaglines, zigzaglabels, lineColor, lineWidth, lineStyle, showLabel, xloc)
draws fresh zigzag for all pivots in the input matrix.
Parameters:
zigzagmatrix: Matrix containing zigzag pivots, bars, bar time, direction and level
zigzaglines: array to which all newly created lines will be added
zigzaglabels: array to which all newly created lables will be added
lineColor: Zigzag line color
lineWidth: Zigzag line width
lineStyle: Zigzag line style
showLabel: Flag to indicate display pivot labels
xloc: xloc preference for drawing lines/labels
Returns: [array<line> zigzaglines, array<label> zigzaglabels]
發行說明
v2Just updating library reference.
發行說明
v3發行說明
v4發行說明
v5發行說明
v6Added:
iZigzag(length, h, l, numberOfPivots)
calculates plain zigzag based on input array
Parameters:
length: Zigzag Length
h: array containing high values of a series
l: array containing low values of a series
numberOfPivots: Number of max pivots to be returned
Returns: matrix<float> zigzagmatrix
發行說明
v7發行說明
v8發行說明
v9Minor defect
發行說明
v10Pine腳本庫
秉持 TradingView 一貫的共享精神,作者將此 Pine 程式碼發佈為開源庫,讓社群中的其他 Pine 程式設計師能夠重複使用。向作者致敬!您可以在私人專案或其他開源發佈中使用此庫,但在公開發佈中重複使用該程式碼需遵守社群規範。
Trial - trendoscope.io/trial
Subscribe - trendoscope.io/pricing
Blog - docs.trendoscope.io
Subscribe - trendoscope.io/pricing
Blog - docs.trendoscope.io
免責聲明
這些資訊和出版物並不意味著也不構成TradingView提供或認可的金融、投資、交易或其他類型的意見或建議。請在使用條款閱讀更多資訊。
Pine腳本庫
秉持 TradingView 一貫的共享精神,作者將此 Pine 程式碼發佈為開源庫,讓社群中的其他 Pine 程式設計師能夠重複使用。向作者致敬!您可以在私人專案或其他開源發佈中使用此庫,但在公開發佈中重複使用該程式碼需遵守社群規範。
Trial - trendoscope.io/trial
Subscribe - trendoscope.io/pricing
Blog - docs.trendoscope.io
Subscribe - trendoscope.io/pricing
Blog - docs.trendoscope.io
免責聲明
這些資訊和出版物並不意味著也不構成TradingView提供或認可的金融、投資、交易或其他類型的意見或建議。請在使用條款閱讀更多資訊。