OPEN-SOURCE SCRIPT
已更新 Enhanced McClellan Summation Index
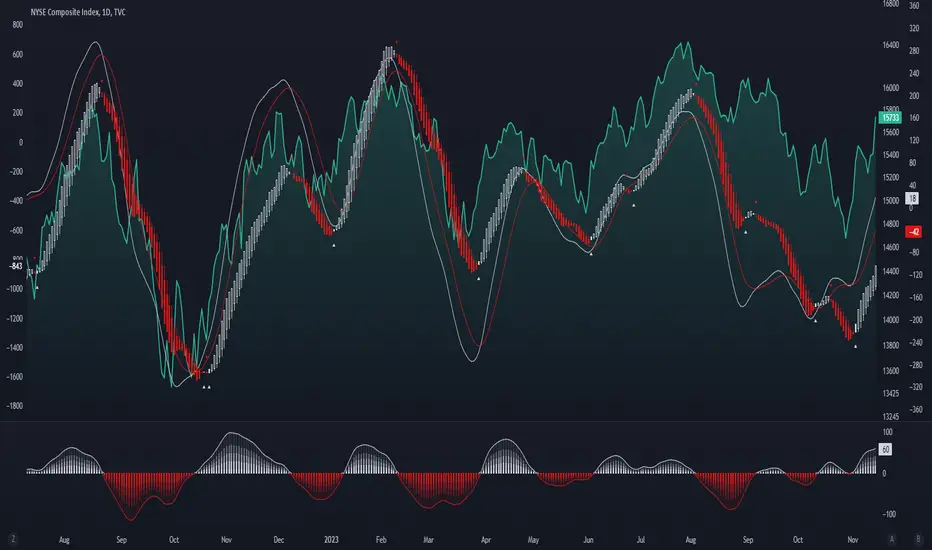
The Enhanced McClellan Summation Index (MSI) is a comprehensive tool that transforms the MSI indicator with Heikin-Ashi visualization, offering improved trend analysis and momentum insights. This indicator includes MACD and it's histogram calculations to refine trend signals, minimize false positives and offer additional momentum analysis.
Methodology:
McClellan Summation Index (MSI) -
The MSI begins by calculating the ratio between advancing and declining issues in the specified index.
float decl = 𝘐𝘯𝘥𝘪𝘤𝘦 𝘥𝘦𝘤𝘭𝘪𝘯𝘪𝘯𝘨 𝘪𝘴𝘴𝘶𝘦𝘴
float adv = 𝘐𝘯𝘥𝘪𝘤𝘦 𝘢𝘥𝘷𝘢𝘯𝘤𝘪𝘯𝘨 𝘪𝘴𝘴𝘶𝘦𝘴
float ratio = (adv - decl) / (adv + decl)
It then computes a cumulative sum of the MACD (the difference between a 19-period EMA and a 39-period EMA) of this ratio. The result is a smoothed indicator reflecting market breadth and momentum.
macd(float r) =>
ta.ema(r, 19) - ta.ema(r, 39)
float msi = ta.cum(macd(ratio))
Heikin-Ashi Transformation -
Heikin-Ashi is a technique that uses a modified candlestick formula to create a smoother representation of price action. It averages the open, close, high, and low prices of the current and previous periods. This transformation reduces noise and provides a clearer view of trends.
type bar
float o = open
float h = high
float l = low
float c = close
bar b = bar.new()
float ha_close = math.avg(b.o, b.h, b.l, b.c)
MACD and Histogram -
The Enhanced MSI incorporates MACD and histogram calculations to provide additional momentum analysis and refine trend signals. The MACD represents the difference between the 12-period EMA and the 26-period EMA of the MSI. The histogram is the visual representation of the difference between the MACD and its signal line.
Options:
- Index Selection - Choose from
 NYA,
NYA,  NDX, or XAX to tailor the MSI-HA to the desired market index.
 - MACD Settings - Adjust the parameters for the MACD calculation to fine-tune the indicator's responsiveness.
- Ratio Multiplier - Apply scaling to the MSI to suit different market conditions and indices.
Benefits of Heikin-Ashi -
- Smoothed Trends - Heikin-Ashi reduces market noise, providing a more apparent and smoothed representation of trends.
- Clearer Patterns - Candlestick patterns are more distinct, aiding in the identification of trend reversals and continuations.
Utility and Use Cases:
- Trend & Momentum Analysis - Utilize the tool's Heikin-Ashi visualization for clearer trend identification in confluence with it's MACD and histogram to gain additional insights into the strength and direction of trends, while filtering out potential false positives.
- Breadth Analysis - Explore market breadth through the MSI's cumulative breadth indicator, gauging the overall health and strength of the underlying market.
- Alerts Setup Guide -
The Enhanced MSI is a robust indicator that combines the breadth analysis of the McClellan Summation Index with the clarity of Heikin-Ashi visualization and additional momentum insights from MACD and histogram calculations. Its customization options make it adaptable to various indices and market conditions, offering traders a comprehensive tool for trend and momentum analysis.
發行說明
improved methodology, added support for plot export to new SuperTrend ToolKit發行說明
Added alerts, improved methodology.發行說明
Added option for any alert call.開源腳本
秉持TradingView一貫精神,這個腳本的創作者將其設為開源,以便交易者檢視並驗證其功能。向作者致敬!您可以免費使用此腳本,但請注意,重新發佈代碼需遵守我們的社群規範。
免責聲明
這些資訊和出版物並非旨在提供,也不構成TradingView提供或認可的任何形式的財務、投資、交易或其他類型的建議或推薦。請閱讀使用條款以了解更多資訊。
免責聲明
這些資訊和出版物並非旨在提供,也不構成TradingView提供或認可的任何形式的財務、投資、交易或其他類型的建議或推薦。請閱讀使用條款以了解更多資訊。