PROTECTED SOURCE SCRIPT
已更新 Dot On Plan | Economic Cycle Analysis v2.4
This closed-source script applies a structured macroeconomic model to classify economic regimes in real time, using inter-asset ratios and yield spreads. It helps traders and analysts interpret broader market conditions—such as expansion, stagflation, deflation, or supply shocks—through well-established market proxies.
🔍 Core Metrics and Logic
The script tracks the following macro indicators:
- **Copper/Oil Ratio**: A proxy for industrial activity vs. energy costs (Copper futures ÷ Oil futures). A rising ratio signals growth optimism; a falling ratio suggests weakening demand.
- **TIPS Spread (Breakeven Inflation)**: The difference between 10Y Treasury yields and 10Y TIPS yields, reflecting inflation expectations. A high spread indicates inflationary pressure.
- **Gold/Oil Ratio**: Measures market stress (Gold futures ÷ Oil futures). A rising ratio often appears in disinflationary or crisis environments.
- **Copper/Gold Ratio**: A "growth vs. safety" indicator. Rising indicates risk-on confidence; falling suggests risk aversion.
Each ratio is smoothed with a moving average to identify trends, evaluating direction and momentum. Trend strength is assessed using a short-term slope and a statistical threshold to detect persistence.
🧭 Economic Regime Classification
The script combines these metrics to identify 17 distinct economic states, such as:
- Typical Expansion: Indicates strong growth and inflation expectations with low safe-haven demand.
- Stagflation Risk: Reflects cost-push inflation with weak growth and high safe-haven demand.
- Supply Shock Conditions: Signals rising inflation and uncertainty, often due to geopolitical events.
Regime classification is based on the interaction of these metrics and their positioning relative to long-term trends. The specific weighting and logic are proprietary, ensuring a unique approach.
📊 Features
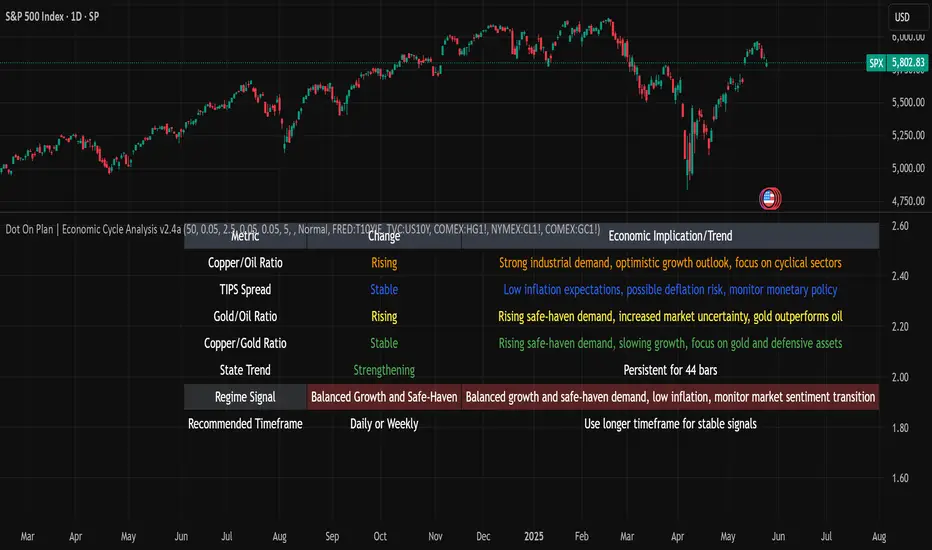
- Live macro regime status table with trend updates and economic implications.
- Visual plots of key ratios and optional moving averages.
- Customizable alerts for key regimes (e.g., stagflation onset, expansion reentry).
- Full customization for MA periods, ratio thresholds, TIPS threshold, and table update frequency.
📈 How to Use
- Apply on daily or weekly charts for stable macro signals (adjustable via "Data Timeframe" input).
- Customize thresholds and MA periods to match your market view.
- Use regime outputs to guide allocation (e.g., cyclical assets in expansion, defensive assets in stagflation).
⚠️ Disclaimer
This script is for informational and educational purposes only and does not constitute financial or investment advice. Past performance is not indicative of future results. Always conduct your own research and consult a qualified financial advisor before trading. The underlying calculation logic is proprietary and not disclosed in full.
🔍 Core Metrics and Logic
The script tracks the following macro indicators:
- **Copper/Oil Ratio**: A proxy for industrial activity vs. energy costs (Copper futures ÷ Oil futures). A rising ratio signals growth optimism; a falling ratio suggests weakening demand.
- **TIPS Spread (Breakeven Inflation)**: The difference between 10Y Treasury yields and 10Y TIPS yields, reflecting inflation expectations. A high spread indicates inflationary pressure.
- **Gold/Oil Ratio**: Measures market stress (Gold futures ÷ Oil futures). A rising ratio often appears in disinflationary or crisis environments.
- **Copper/Gold Ratio**: A "growth vs. safety" indicator. Rising indicates risk-on confidence; falling suggests risk aversion.
Each ratio is smoothed with a moving average to identify trends, evaluating direction and momentum. Trend strength is assessed using a short-term slope and a statistical threshold to detect persistence.
🧭 Economic Regime Classification
The script combines these metrics to identify 17 distinct economic states, such as:
- Typical Expansion: Indicates strong growth and inflation expectations with low safe-haven demand.
- Stagflation Risk: Reflects cost-push inflation with weak growth and high safe-haven demand.
- Supply Shock Conditions: Signals rising inflation and uncertainty, often due to geopolitical events.
Regime classification is based on the interaction of these metrics and their positioning relative to long-term trends. The specific weighting and logic are proprietary, ensuring a unique approach.
📊 Features
- Live macro regime status table with trend updates and economic implications.
- Visual plots of key ratios and optional moving averages.
- Customizable alerts for key regimes (e.g., stagflation onset, expansion reentry).
- Full customization for MA periods, ratio thresholds, TIPS threshold, and table update frequency.
📈 How to Use
- Apply on daily or weekly charts for stable macro signals (adjustable via "Data Timeframe" input).
- Customize thresholds and MA periods to match your market view.
- Use regime outputs to guide allocation (e.g., cyclical assets in expansion, defensive assets in stagflation).
⚠️ Disclaimer
This script is for informational and educational purposes only and does not constitute financial or investment advice. Past performance is not indicative of future results. Always conduct your own research and consult a qualified financial advisor before trading. The underlying calculation logic is proprietary and not disclosed in full.
發行說明
This closed-source script applies a structured and multi-layered macroeconomic model to classify real-time economic regimes. It combines four key inter-asset market ratios with trend logic and contextual evaluation to help users identify phases such as expansion, stagflation, disinflation, and supply-driven shocks.The model computes and tracks the following normalized ratios using live market data:
Copper/Oil Ratio (HG1!/CL1!)
→ Industrial demand vs. energy cost proxy.
↑ Rising = improving growth outlook; ↓ Falling = slowdown risk.
TIPS Spread (US10Y - T10YIE from FRED)
→ Real-time market-based inflation expectation measure.
2.5% = inflation risk; < 1.5% = disinflation/deflation concern.
Gold/Oil Ratio (GC1!/CL1!)
→ Safe-haven vs. commodity demand stress indicator.
↑ Rising = fear-driven positioning; ↓ Falling = risk-on sentiment.
Copper/Gold Ratio (HG1!/GC1!)
→ Risk appetite indicator: growth metals vs. safe haven.
↑ Rising = pro-growth regime; ↓ Falling = risk-off shift.
How the Regime Logic Works:
1)Trend Classification
Each ratio is smoothed using a user-defined moving average (default = 50) to extract the intermediate trend.
Then, a 5-bar slope is calculated to determine trend direction.
2)Threshold Evaluation
Each smoothed ratio is evaluated against a threshold zone (set by the user, e.g., ±0.05) to classify as:
Rising,Falling,Stable.
3)Composite State Mapping
The combination of all four ratio trend states is fed into a matrix of 17 possible economic conditions, including:
Typical Expansion,Stagflation,Supply Shock,Monetary Reflation,Disinflation Recovery,High-Risk Defensive Regime, etc.
4)Trend Strength Check (Persistence Filter)
To avoid noise, trend signals are confirmed using a normalized slope filter (≥ 0.5× std dev over 20 bars = valid signal).
5)Output Generation
A regime label and macro status table are updated on each bar, displaying:
Each metric’s trend direction,Slope value,Current regime state,Duration in bars (time spent in the current regime),Optional economic explanation.
Fully customizable:
MA period, Thresholds, Slope sensitivity, Chart, Font size.
Recommended Usage:
Timeframe: Daily or Weekly
Symbols: Any assets (e.g. SPX)
Disclaimer:
This script is provided for informational and educational purposes only.
It does not constitute financial advice, nor does it guarantee performance.
受保護腳本
此腳本以閉源形式發佈。 不過,您可以自由使用,沒有任何限制 — 點擊此處了解更多。
Market insights & indicators
免責聲明
這些資訊和出版物並非旨在提供,也不構成TradingView提供或認可的任何形式的財務、投資、交易或其他類型的建議或推薦。請閱讀使用條款以了解更多資訊。
免責聲明
這些資訊和出版物並非旨在提供,也不構成TradingView提供或認可的任何形式的財務、投資、交易或其他類型的建議或推薦。請閱讀使用條款以了解更多資訊。