PROTECTED SOURCE SCRIPT
已更新 Market Turn Identifier

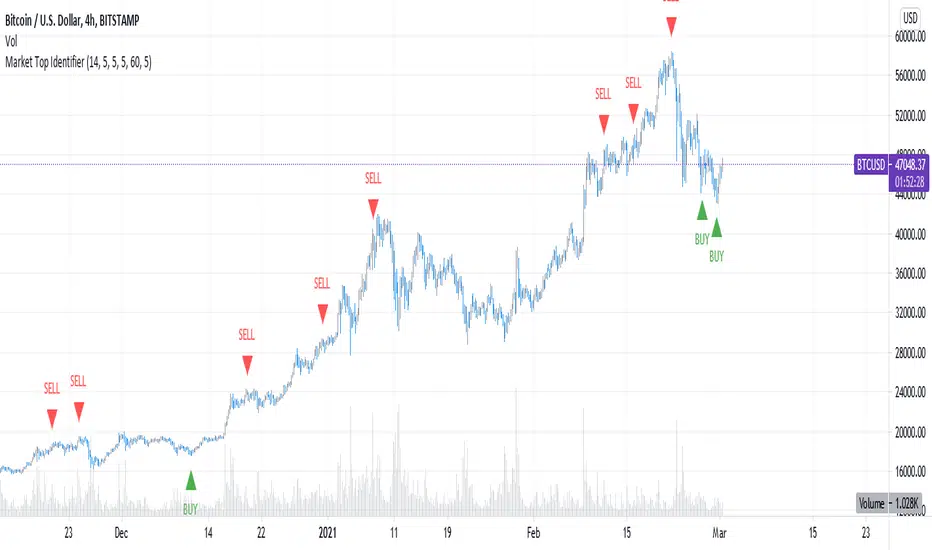
How to identify tops and bottoms?
This script uses a combination of indicators to determine if it is a top or a bottom. It is best used in a bull market, where prices will extend in both directions. Good example is, cryptocurrencies.
Because prices extend on both directions, RSI divergences are great signs. Volume likewise. MACD is used as a final trigger. All of these signs don't have to necessarily happen on 1 exact candle, but should be spatially close.
List of requirements:
Top
Bottom
*MACD crossunder
RSI bullish divergence
Increasing volume (COMING SOON)
This works the best in a medium time frame, from 2h-12h chart.
This script uses a combination of indicators to determine if it is a top or a bottom. It is best used in a bull market, where prices will extend in both directions. Good example is, cryptocurrencies.
Because prices extend on both directions, RSI divergences are great signs. Volume likewise. MACD is used as a final trigger. All of these signs don't have to necessarily happen on 1 exact candle, but should be spatially close.
List of requirements:
Top
- MACD crossover
RSI bear divergence
Dropping volume (COMING SOON)
Bottom
*MACD crossunder
RSI bullish divergence
Increasing volume (COMING SOON)
This works the best in a medium time frame, from 2h-12h chart.
發行說明
Cleanup chart.發行說明
Fix signals not getting positioned properly.受保護腳本
此腳本以閉源形式發佈。 不過,您可以自由且不受任何限制地使用它 — 在此處了解更多資訊。
免責聲明
這些資訊和出版物並不意味著也不構成TradingView提供或認可的金融、投資、交易或其他類型的意見或建議。請在使用條款閱讀更多資訊。
受保護腳本
此腳本以閉源形式發佈。 不過,您可以自由且不受任何限制地使用它 — 在此處了解更多資訊。
免責聲明
這些資訊和出版物並不意味著也不構成TradingView提供或認可的金融、投資、交易或其他類型的意見或建議。請在使用條款閱讀更多資訊。