PROTECTED SOURCE SCRIPT
Nearest Ichimoku Levels (Multi-Timeframe)
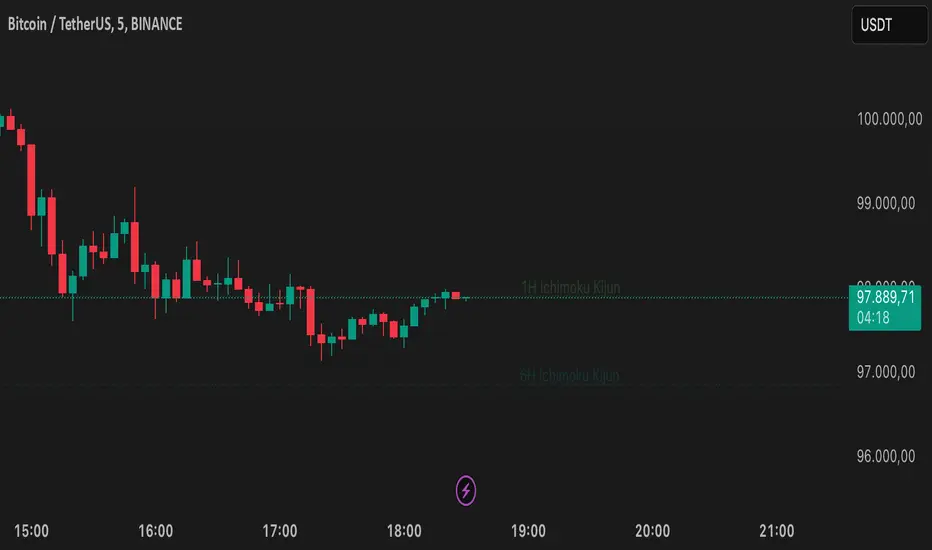
This indicator dynamically calculates the nearest Ichimoku levels (Tenkan-sen & Kijun-sen) across multiple timeframes. It helps traders identify trend direction, dynamic support/resistance levels, and key reversal zones.
📌 Key Features:
✔ Multi-Timeframe Support: Works across 1min to 1M (monthly) timeframes.
✔ Dynamic Ichimoku Levels: Calculates Tenkan-sen (Conversion Line) and Kijun-sen (Base Line) in real-time.
✔ Customizable Ichimoku Settings: Adjustable Tenkan-sen & Kijun-sen periods.
✔ Auto Detection: Finds and plots the nearest Ichimoku levels above and below the price.
✔ Customizable Display: Adjustable line style, thickness, and colors for clarity.
✔ Clear Labels: Displays timeframe and Ichimoku level directly on the chart.
🛠 How to Use:
Enable preferred timeframes and set Ichimoku parameters.
The script will plot the closest Tenkan-sen and Kijun-sen levels automatically.
Labels show the timeframe and Ichimoku level for better clarity.
⚠ Note:
For technical analysis only, not financial advice.
Too many enabled timeframes may clutter the chart—enable only needed ones.
🚀 Perfect for:
✔ Identifying Trend Direction
✔ Tracking Ichimoku Support & Resistance Levels
✔ Analyzing Market Conditions Across Timeframes
受保護腳本
此腳本以閉源形式發佈。 不過,您可以自由使用,沒有任何限制 — 點擊此處了解更多。
免責聲明
這些資訊和出版物並非旨在提供,也不構成TradingView提供或認可的任何形式的財務、投資、交易或其他類型的建議或推薦。請閱讀使用條款以了解更多資訊。
受保護腳本
此腳本以閉源形式發佈。 不過,您可以自由使用,沒有任何限制 — 點擊此處了解更多。
免責聲明
這些資訊和出版物並非旨在提供,也不構成TradingView提供或認可的任何形式的財務、投資、交易或其他類型的建議或推薦。請閱讀使用條款以了解更多資訊。