OPEN-SOURCE SCRIPT
[Global Contraction Expansion Index SGM]
Script Features
Dynamic Period Choice: The user can adjust the calculation period (period) for relative performance, allowing flexibility according to specific market analysis needs.
Sector Selection: The script takes into account different economic sectors through well-known ETFs like QQQ (technology), XLF (financial), XLY (consumer discretionary), XLV (healthcare), XLI (industrial) and XLE (energy). This diversification helps gain a general overview of economic health across different market segments.
Relative Performance Calculation: For each sector, the script calculates the relative performance using a simple moving average (SMA) of the price change over the specified period. This helps identify price trends adjusted for normal market fluctuations.
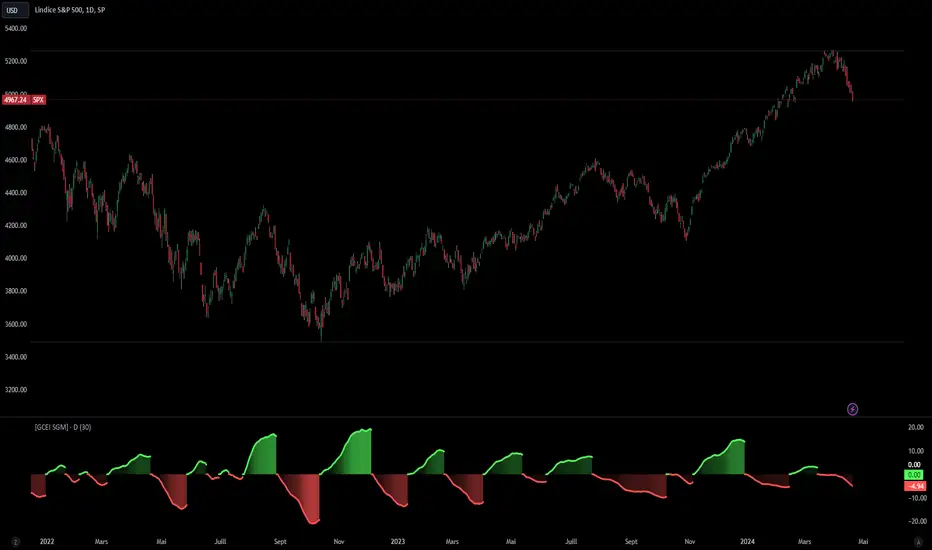
GCEI Index: The GCEI Index is calculated as the average of the relative performance of all sectors, multiplied by 100 to express it as a percentage. This provides an overall indicator of sectoral economic performance.
Crossover Signals: The script detects and marks points where the overall index (GCEI) crosses its own exponential moving average (emaGCEI), indicating potential changes in the overall trend of market performance.
Visualization: Results are visualized through graphs, where positive and negative regions are colored differently. Fills between the zero line and the index curves make it easy to see periods of contraction or expansion
When this index diverges from the SP500, it may be a sign that the technology sector is outperforming other sectors.

Dynamic Period Choice: The user can adjust the calculation period (period) for relative performance, allowing flexibility according to specific market analysis needs.
Sector Selection: The script takes into account different economic sectors through well-known ETFs like QQQ (technology), XLF (financial), XLY (consumer discretionary), XLV (healthcare), XLI (industrial) and XLE (energy). This diversification helps gain a general overview of economic health across different market segments.
Relative Performance Calculation: For each sector, the script calculates the relative performance using a simple moving average (SMA) of the price change over the specified period. This helps identify price trends adjusted for normal market fluctuations.
GCEI Index: The GCEI Index is calculated as the average of the relative performance of all sectors, multiplied by 100 to express it as a percentage. This provides an overall indicator of sectoral economic performance.
Crossover Signals: The script detects and marks points where the overall index (GCEI) crosses its own exponential moving average (emaGCEI), indicating potential changes in the overall trend of market performance.
Visualization: Results are visualized through graphs, where positive and negative regions are colored differently. Fills between the zero line and the index curves make it easy to see periods of contraction or expansion
When this index diverges from the SP500, it may be a sign that the technology sector is outperforming other sectors.
開源腳本
秉持TradingView一貫精神,這個腳本的創作者將其設為開源,以便交易者檢視並驗證其功能。向作者致敬!您可以免費使用此腳本,但請注意,重新發佈代碼需遵守我們的社群規範。
Sigaud | Junior Quantitative Trader & Developer
Combining technical expertise with analytical precision.
Gaining experience and growing in the field.
📧 Contact: from the website
Combining technical expertise with analytical precision.
Gaining experience and growing in the field.
📧 Contact: from the website
免責聲明
這些資訊和出版物並非旨在提供,也不構成TradingView提供或認可的任何形式的財務、投資、交易或其他類型的建議或推薦。請閱讀使用條款以了解更多資訊。