INVITE-ONLY SCRIPT
VWAP by YSTC
This is a PAID Indicator from Volume Profile and VWAP Pack.
According to payment you will either get a TradingView account with indicators activated or
Have to send an email to contact@ystc.in with the email you used to sign up with us, and with your TradingView Username.
The script is available (for free) to YSTC's Course members of "Trading with PAV".
VWAP stands for Volume Weighted Average Price. It is a trading indicator that shows where the "fair value" of the instrument is. It is calculated using PRICE and VOLUMES.
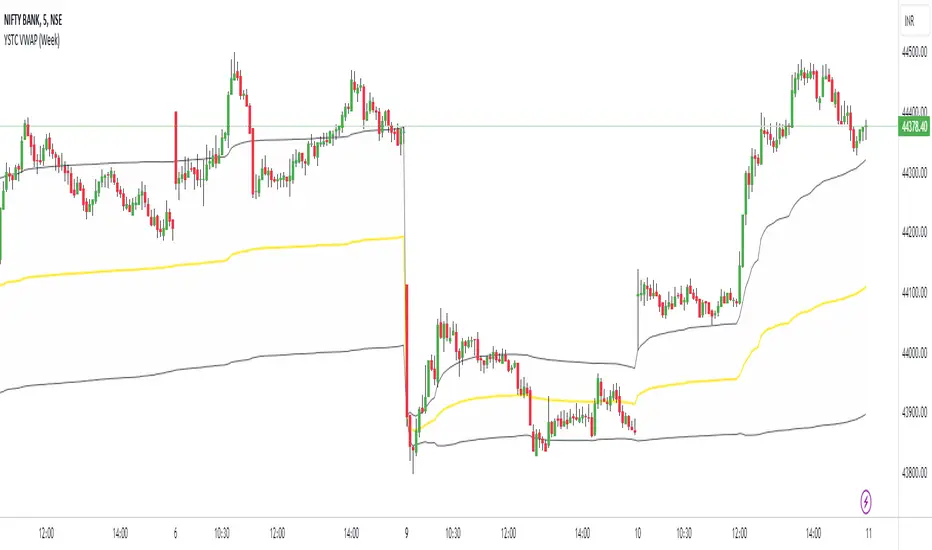
VWAP by YSTC shows: VWAP , 1st Deviation, 2nd Deviation and 3rd Deviations.
This VWAP also has Futures volume shown for Index.
You can easily switch between these VWAP calculations:
Daily (ideal for intraday trading)
Weekly (ideal for intraday trading)
Monthly (ideal for long-term/swing trading)
Yearly (ideal for long-term/swing trading)
How does VWAP work?
WVAP is a simple line that shows on a price chart. It shows where the "fair value" of the trading instrument is.
If the price is above this line, then the instrument is overpriced and its price should drop back to the VWAP line.
If the price is below the line, then it is undervalued and it should move upwards back to the VWAP line.

How is VWAP different from EMA , SMA , and other standard Average indicators?
Standard indicators that show the average price ( EMA , SMA , ...) are calculated using two variables: PRICE and TIME.
VWAP brings VOLUME into the equation. It is calculated using three variables: PRICE, TIME and VOLUMES.
This is realty important, because VOLUMES make all the difference!
How to use VWAP in trading?
There are more ways how to trade using the VWAP. The simplest way comes from the logic, that the VWAP represents a "fair value" and that the price should always return to it.
Many trading algorithms work like this: they BUY when the price is BELOW VWAP , and they SELL when the price is ABOVE VWAP .
You can image VWAP (yellow line) as a magnet.

VWAP deviations
The VWAP indicator which I developed has also the option to calculate 1st and 2nd VWAP deviations. Those are standard deviations calculated from the VWAP and they are really useful. In fact, most of my VWAP trading strategies are based on deviations.
Use VWAP deviations to identify TREND and ROTATION
When the Deviations move sideways (horizontally), then there is a ROTATION:

When the Deviations move upwards or downwards (vertically), then there is a TREND:

Sometimes, you can tell whether there is ROTATION or a TREND by just looking at the simple price chart. But there are cases when it is not so clear.
A healthy trend needs to be volume driven. There needs to be big money behind the move (the big guys need to join the party). VWAP and its Deviations reflect that because they track VOLUMES.
That's why they are so good at revealing trends!
In my trading, I like to use the Deviations as Supports and Resistances. The price has nice reactions to them. Especially to the 1st and 2nd Deviation, which I like to use the most in my trading strategies.
A good place for a Take Profit is the yellow VWAP line. The reason is that it works as a magnet - the price tends to return to it.
You can add this script to your chart by clicking "Add to favorite indicators" below.
Have Questions ?
contact@ystc.in
Free Stock Market Introduction Available.
Name: Yogesh Patil (YS Trading Coach).
Contact: +91 9637070868.
Time: Monday to Friday (10:00 AM - 07:00 PM).
According to payment you will either get a TradingView account with indicators activated or
Have to send an email to contact@ystc.in with the email you used to sign up with us, and with your TradingView Username.
The script is available (for free) to YSTC's Course members of "Trading with PAV".
VWAP stands for Volume Weighted Average Price. It is a trading indicator that shows where the "fair value" of the instrument is. It is calculated using PRICE and VOLUMES.
VWAP by YSTC shows: VWAP , 1st Deviation, 2nd Deviation and 3rd Deviations.
This VWAP also has Futures volume shown for Index.
You can easily switch between these VWAP calculations:
Daily (ideal for intraday trading)
Weekly (ideal for intraday trading)
Monthly (ideal for long-term/swing trading)
Yearly (ideal for long-term/swing trading)
How does VWAP work?
WVAP is a simple line that shows on a price chart. It shows where the "fair value" of the trading instrument is.
If the price is above this line, then the instrument is overpriced and its price should drop back to the VWAP line.
If the price is below the line, then it is undervalued and it should move upwards back to the VWAP line.
How is VWAP different from EMA , SMA , and other standard Average indicators?
Standard indicators that show the average price ( EMA , SMA , ...) are calculated using two variables: PRICE and TIME.
VWAP brings VOLUME into the equation. It is calculated using three variables: PRICE, TIME and VOLUMES.
This is realty important, because VOLUMES make all the difference!
How to use VWAP in trading?
There are more ways how to trade using the VWAP. The simplest way comes from the logic, that the VWAP represents a "fair value" and that the price should always return to it.
Many trading algorithms work like this: they BUY when the price is BELOW VWAP , and they SELL when the price is ABOVE VWAP .
You can image VWAP (yellow line) as a magnet.
VWAP deviations
The VWAP indicator which I developed has also the option to calculate 1st and 2nd VWAP deviations. Those are standard deviations calculated from the VWAP and they are really useful. In fact, most of my VWAP trading strategies are based on deviations.
Use VWAP deviations to identify TREND and ROTATION
When the Deviations move sideways (horizontally), then there is a ROTATION:
When the Deviations move upwards or downwards (vertically), then there is a TREND:
Sometimes, you can tell whether there is ROTATION or a TREND by just looking at the simple price chart. But there are cases when it is not so clear.
A healthy trend needs to be volume driven. There needs to be big money behind the move (the big guys need to join the party). VWAP and its Deviations reflect that because they track VOLUMES.
That's why they are so good at revealing trends!
In my trading, I like to use the Deviations as Supports and Resistances. The price has nice reactions to them. Especially to the 1st and 2nd Deviation, which I like to use the most in my trading strategies.
A good place for a Take Profit is the yellow VWAP line. The reason is that it works as a magnet - the price tends to return to it.
You can add this script to your chart by clicking "Add to favorite indicators" below.
Have Questions ?
contact@ystc.in
Free Stock Market Introduction Available.
Name: Yogesh Patil (YS Trading Coach).
Contact: +91 9637070868.
Time: Monday to Friday (10:00 AM - 07:00 PM).
僅限邀請腳本
僅作者批准的使用者才能訪問此腳本。您需要申請並獲得使用許可,通常需在付款後才能取得。更多詳情,請依照作者以下的指示操作,或直接聯絡YSTradingCoach。
請注意,此私人、僅限受邀使用者使用的腳本未經腳本審核員審核,其是否符合社群規範尚待確定。 TradingView不建議在未完全信任作者並了解其運作方式的情況下購買或使用腳本。您也可以在我們的社群腳本中找到免費的開源替代方案。
作者的說明
A PAID Indicator from Volume Profile and VWAP Pack.
According to payment you will either get a TradingView account with indicators activated or
Have to send an email to contact@ystc.in with the email you used to sign up with us, and your TV username.
免責聲明
這些資訊和出版物並非旨在提供,也不構成TradingView提供或認可的任何形式的財務、投資、交易或其他類型的建議或推薦。請閱讀使用條款以了解更多資訊。