HPotter

Pivot Detector Oscillator, by Giorgos E. Siligardos
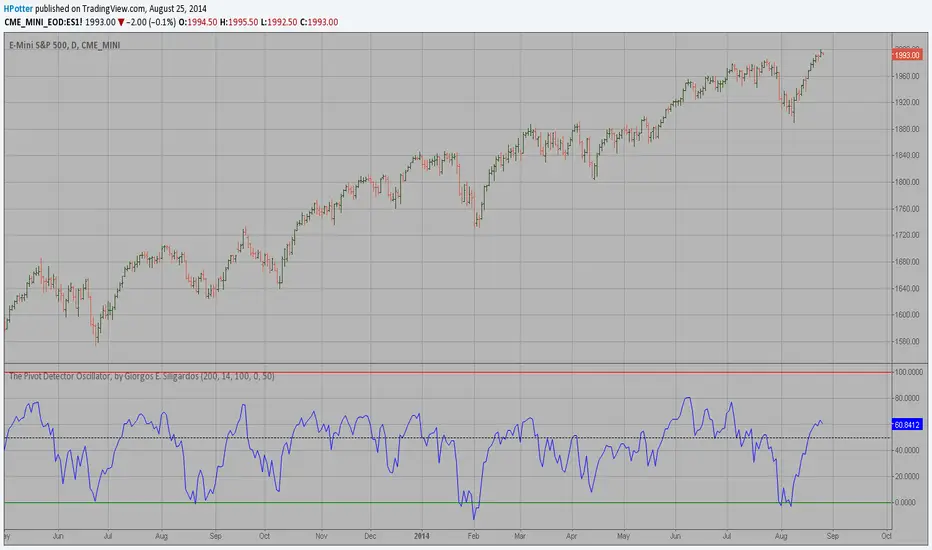
The Pivot Detector Oscillator, by Giorgos E. Siligardos
The related article is copyrighted material from Stocks & Commodities 2009 Sep

開源腳本

本著真正的TradingView精神,該腳本的作者將其開源發布,以便交易者可以理解和驗證它。為作者喝彩吧!您可以免費使用它,但在出版物中重複使用此代碼受網站規則的約束。 您可以收藏它以在圖表上使用。

免責聲明

這些資訊和出版物並不意味著也不構成TradingView提供或認可的金融、投資、交易或其他類型的意見或建議。請在使用條款閱讀更多資訊。

想在圖表上使用此腳本?
////////////////////////////////////////////////////////////
//  Copyright by HPotter v1.0 26/08/2014
// The Pivot Detector Oscillator, by Giorgos E. Siligardos
// The related article is copyrighted material from Stocks & Commodities 2009 Sep
////////////////////////////////////////////////////////////
study(title="The Pivot Detector Oscillator, by Giorgos E. Siligardos")
Length_MA = input(200, minval=1)
Length_RSI = input(14, minval=1)
UpBand = input(100, minval=1)
DnBand = input(0)
MidlleBand = input(50)
hline(MidlleBand, color=black, linestyle=dashed)
hline(UpBand, color=red, linestyle=line)
hline(DnBand, color=green, linestyle=line)
xMA = sma(close, Length_MA)
xRSI = rsi(close, Length_RSI)
nRes = iff(close > xMA, (xRSI - 35) / (85-35), 
        iff(close <= xMA, (xRSI - 20) / (70 - 20), 0))
plot(nRes * 100, color=blue, title="Pivot Detector Oscillator")