OPEN-SOURCE SCRIPT
已更新 Multi Oscillators Price Levels

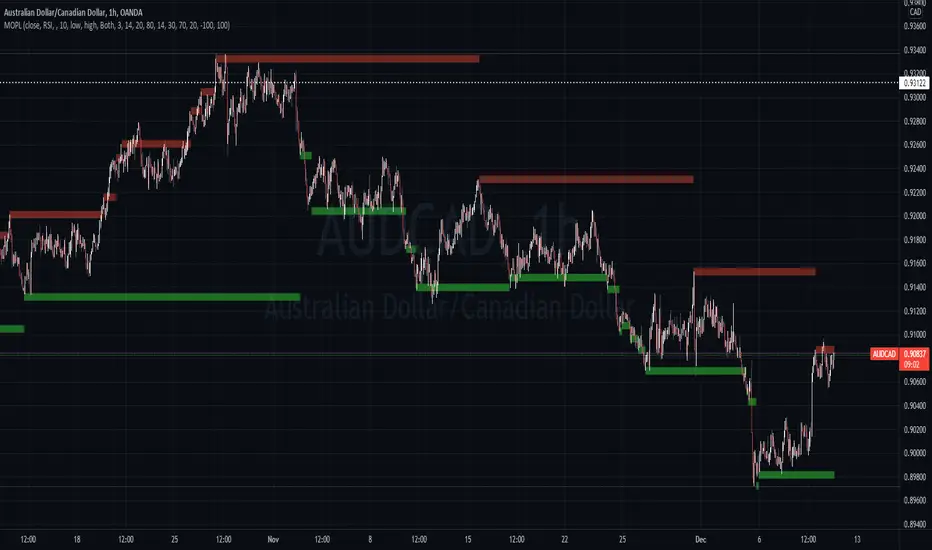
This script draws price levels corresponding to the highest price reached in overbought situations, and the lowest price reached in oversold situations, depending on the oscillator and the timeframe the user has configured.
These levels correspond, most of time, to good supports and resistances prices.
Price levels drawings can be based on the following indicators:
You can customize this indicator with the following options:
Here are a few examples of different configurations:


This script will probably be modified in the future, don't hesitate to suggest any improvement.
These levels correspond, most of time, to good supports and resistances prices.
Price levels drawings can be based on the following indicators:
- Stochastic RSI (default)
- Stochastic CCI
- RSI
- CCI
You can customize this indicator with the following options:
- Source: The candle source to use in indicators calculation
- Source Indicator: The indicator on which you cant to base your levels
- Timeframe: The timeframe on which you want to apply the selected indicator, and calculate levels
- Show supports/resistances: enable/disable price levels, depending on there status (overbought - resistances) / (oversold - supports)
- Lines width: width of price levels. (set to 10 by default in order to draw "zones")
- Supports/Resistances source: Select the candle data you cant to use to draw supports and resistances levels
- Extend levels: Select the line extension for price levels
- Levels color: Select the desired color for price levels
- And of course , all parameters corresponding to the supported indicators (Stoch, RSI, CCI)
Here are a few examples of different configurations:
This script will probably be modified in the future, don't hesitate to suggest any improvement.
發行說明
Updates:- Supports and resistances are now represented in different colors
- Default timeframe is now the current one
- Support and resistances are not extended anymore in order to avoid chart overloading
- Default parameters are now RSI(14) based on the candles closing price
發行說明
Levels extension added, but set to None by default開源腳本
本著TradingView的真正精神,此腳本的創建者將其開源,以便交易者可以查看和驗證其功能。向作者致敬!雖然您可以免費使用它,但請記住,重新發佈程式碼必須遵守我們的網站規則。
免責聲明
這些資訊和出版物並不意味著也不構成TradingView提供或認可的金融、投資、交易或其他類型的意見或建議。請在使用條款閱讀更多資訊。
開源腳本
本著TradingView的真正精神,此腳本的創建者將其開源,以便交易者可以查看和驗證其功能。向作者致敬!雖然您可以免費使用它,但請記住,重新發佈程式碼必須遵守我們的網站規則。
免責聲明
這些資訊和出版物並不意味著也不構成TradingView提供或認可的金融、投資、交易或其他類型的意見或建議。請在使用條款閱讀更多資訊。