OPEN-SOURCE SCRIPT
LW Structure
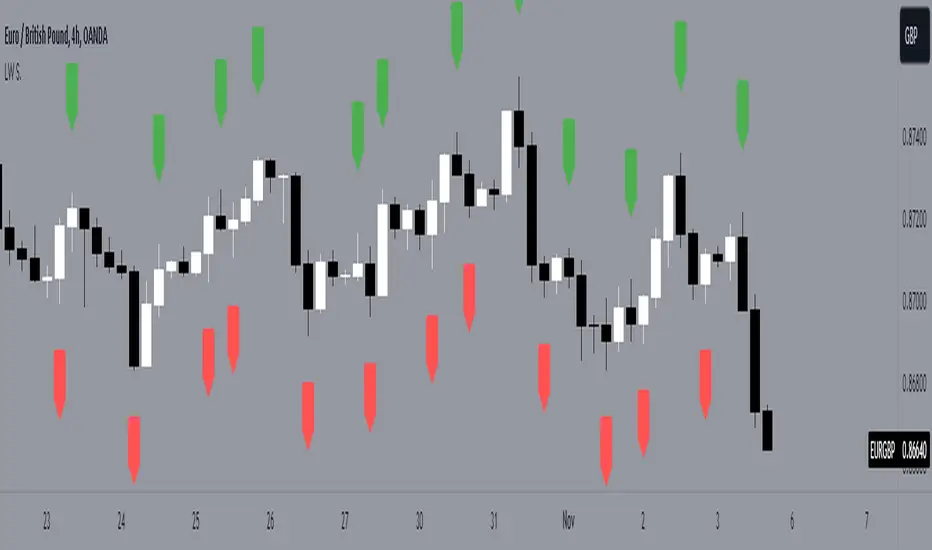
This easy and intuitive tool can be helpful to capture market trends.
This indicator marks the max and the min generated from the price with labels. The green labels are for the max peak and the red label for the min peak. This tool is inspired to the Larry Williams technique to easily catch the trend basing on the decreasing maximums and increasing mininums of the market structure.
Drawing inspiration from the Larry Williams approach, the LW Structure Indicator simplifies the process of recognizing trend patterns through the lens of market structure dynamics.
開源腳本
秉持TradingView一貫精神,這個腳本的創作者將其設為開源,以便交易者檢視並驗證其功能。向作者致敬!您可以免費使用此腳本,但請注意,重新發佈代碼需遵守我們的社群規範。
免責聲明
這些資訊和出版物並非旨在提供,也不構成TradingView提供或認可的任何形式的財務、投資、交易或其他類型的建議或推薦。請閱讀使用條款以了解更多資訊。
免責聲明
這些資訊和出版物並非旨在提供,也不構成TradingView提供或認可的任何形式的財務、投資、交易或其他類型的建議或推薦。請閱讀使用條款以了解更多資訊。